
Figure 4. The activity of Tfh cells follows a different dose-response curve than Th1 or Th2 cells as T cell help is titrated into co-assembled nanofibers.
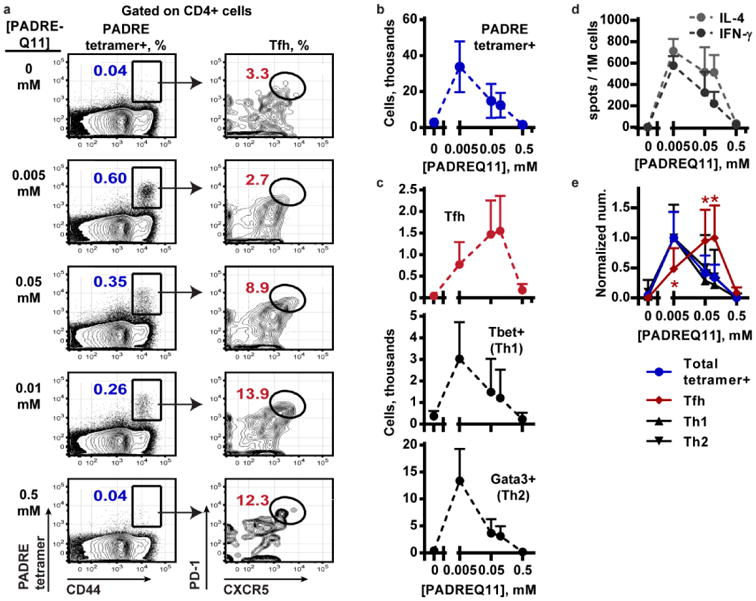
T cell responses were assessed using cells collected from the lymph nodes of mice after immunization and two boosts with E214Q11/PADREQ11. (a) The PADRE-MHC tetramer was used to quantify the PADRE-specific tetramer+ CD4+ T cells (left column) and phenotype them (gating for Tfh shown in right column). A representative result from each dose of PADREQ11 is shown. (b) The numbers of total PADRE tetramer-positive cells and (c) PADRE-specific CXCR5+ PD1+ Tfh cells, Tbet+ Th1, or Gata3+ Th2 cells were quantified. Cell numbers are quantified per mouse, where six draining lymph nodes were collected from each mouse. (d) An ELISPOT quantified the IL-4 and IFN-gamma secreting cells after stimulation with PADRE peptide, which also followed a bell-shaped dose response curve. (e) The response of each cell type was normalized to its maximum, and the responses were compared by 2-way ANOVA. Dunnett's multiple comparisons test was conducted at each dose of PADREQ11, comparing the response of each cell type to the total tetramer+ response. *, p < 0.001. N = 5 mice per group. Mean + standard deviation is shown.