Figure 2.

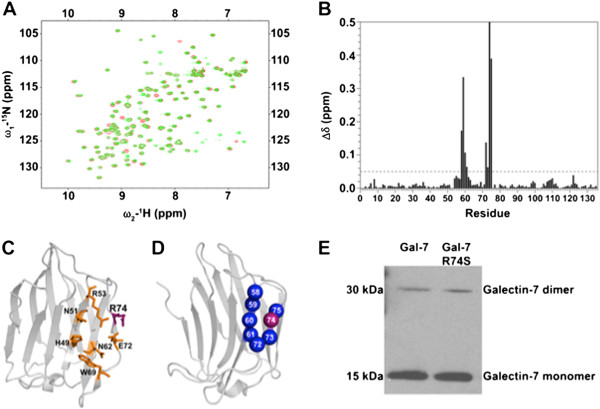
Structural analysis of wild-type gal-7 and the R74S mutant. (A) Superimposed 1H-15N HSQC spectra of wild-type (green) and R74S (red) gal-7 at 310 K and 800 MHz. (B) 1H-15N chemical shift differences Δδ (ppm) caused by the R74S mutation mapped on the primary sequence of gal-7. The 1H-15N weighted average composite chemical shift differences (Δδ) were calculated between WT and variant R74S according to the following equation [17]: Δδ (ppm) = [(Δδ2 HN + Δδ2 N/25)/2]½. (C) Three-dimensional structure of gal-7 showing the general β-sheet topology of the carbohydrate recognition domain (CRD) and the position of the carbohydrate binding site, as delineated by residues H49, N51, R53, N62, W69, E72 and R74. (D) Mapping of 1H-15N chemical shift variations (Δδ) between wtgal-7 and variant R74S on the 3D structure of gal-7 [PDB: 3ZXF]. Residues with chemical shift variations Δδ >0.05 ppm are plotted on the structure of gal-7 (in blue). The position of the R74 residue is shown in purple. (E) Immunoblots showing soluble monomeric and dimeric forms of recombinant gal-7 in a native gel.
