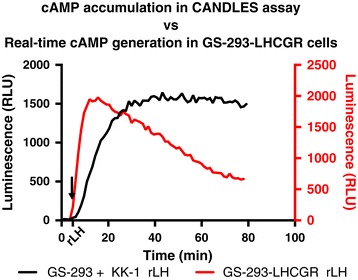
Figure 10.

Comparison of kinetics of cAMP generation using CANDLES with instantaneous cAMP production. cAMP accumulation detected by GS-293 (25,000 cells) upon stimulation of co-cultured KK-1 (75,000 cells) with rLH (100 ng/ml) (black line, left Y-axis) using CANDLES. GS-293 cells stably transfected with a plasmid carrying the Lhcgr cDNA (GS-293-LHCGR) and stimulated with rLH (100 ng/ml) depicts real-time cAMP present in the cells (red line, right Y-axis).
