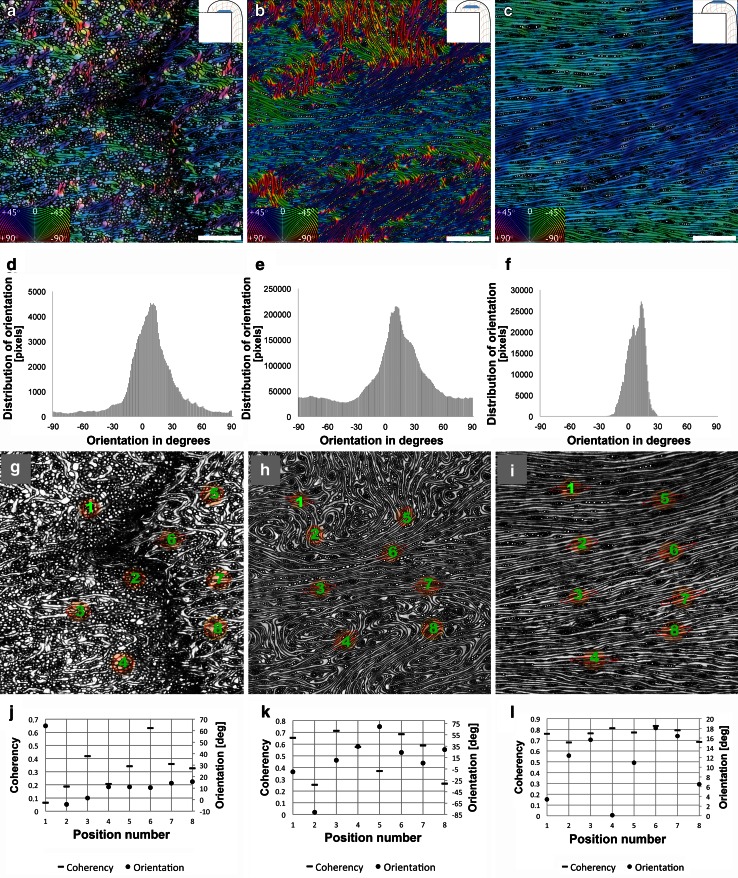
Fig. 4.
Cellular organization of the regenerative tissues of a Douglas fir stump’s overgrowth. Various locations with respect to the cut surface of the stump are shown. a, d, g, j Tissue zone close to the cut surface (1–3 mm). b, e, h, k Central region of overgrowth tissue (16th annual increment). c, f, i, l External part of overgrowth tissue (28th annual increment). a, b, c Color-coded maps of local predominant orientations obtained by digital image processing software. The maps show the angle orientations (degrees) in the transverse sections of tissue regions seen on the microscopic images. d, e, f Histogram distribution of predominant angle orientations in tissue regions on color-coded maps shown in a, b, and c, respectively. g, h, i Coherency coefficients represented geometrically as ellipses on sample positions located on the microscopic images of the same tissue regions seen in a, b and c, respectively. j, k, l Numerical values of angle orientations (degrees) and coherency coefficients for six sample positions on each of the tissue region shown in g, h, and i, respectively. Scale bars = 500 μm

