
Fig. 4.
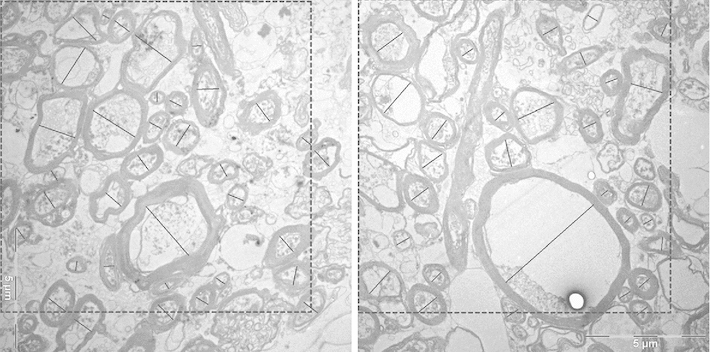
Electron micrographs from the superior longitudinal fascicle of human brain 2, illustrating the selection of profiles. The broken lines indicate the borders of the evaluated area in each electron micrograph. Profiles extending over the upper and left borders are discarded. The black lines within the profiles show how their diameters have been measured. Bars 5