Figure 2.

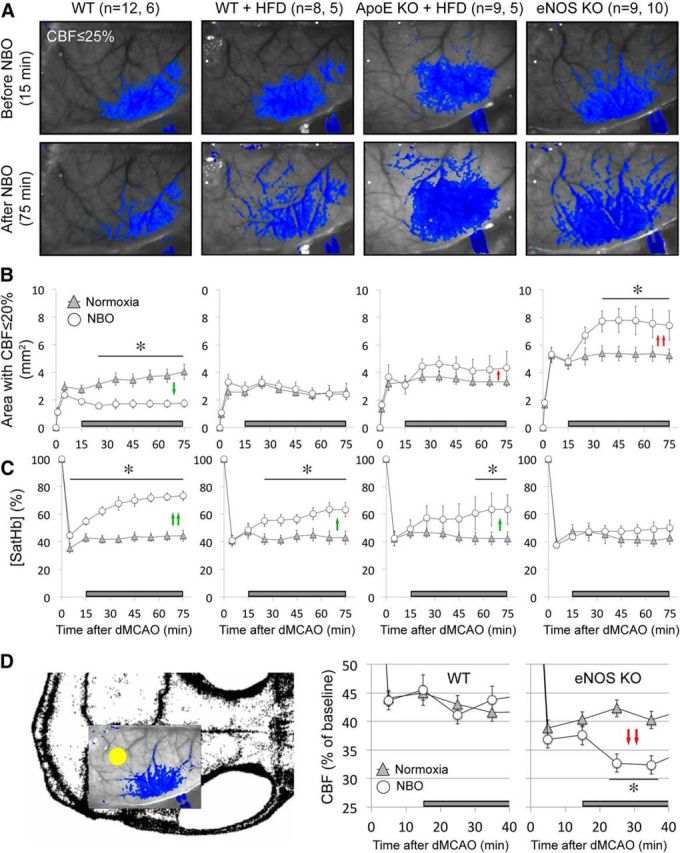
NBO worsens CBF deficit after dMCAO in eNOS−/− and ApoE−/−. A, Representative speckle contrast images taken just before and 60 min after NBO (15 and 75 min after dMCAO, respectively) in WT, WT on HFD (WT + HFD), ApoE KO on HFD (ApoE KO + HFD), and eNOS KO mice. Superimposed in blue are pixels with residual CBF ≤25%. NBO reduced the area of perfusion defect in WT, but increased it in ApoE KO + HFD and in eNOS KO. Imaging field position is shown in D. B, Time course of changes in area of cortex with severe CBF deficit (residual CBF ≤20%) in normoxic and NBO mice. NBO stabilized the area of perfusion defect in WT (green arrows), but abruptly worsened it in eNOS KO and to a lesser extent in ApoE KO + HFD (red arrows). Using a residual CBF threshold of 30% or 40% yielded similar conclusions (data not shown). Time 0 indicates dMCAO and horizontal bar represents 100% O2 starting 15 min after dMCAO. C, Time course of changes in satHb within an ROI placed within the penumbra. NBO rapidly and significantly increased cortical oxygenation in WT, and to a lesser extent in WT + HFD and ApoE KO + HFD groups (green arrows), but failed to do so in eNOS KO, presumably because of significantly worsening perfusion negated increased O2 delivery (see A and B). D, Mouse skull showing the position of imaging field over the right hemisphere, and the ROI used to measure CBF changes in mildly ischemic cortex (yellow dot). NBO did not change perfusion in mildly ischemic cortex away from the ischemic core in WT mice, but abruptly reduced it in eNOS KO (red arrows). *p < 0.05 versus normoxia group, two-way ANOVA for repeated measures followed by Fisher's LSD. Vertical error bars indicate ± SEM. Sample sizes are shown next to each group in A.
