
Figure 1.
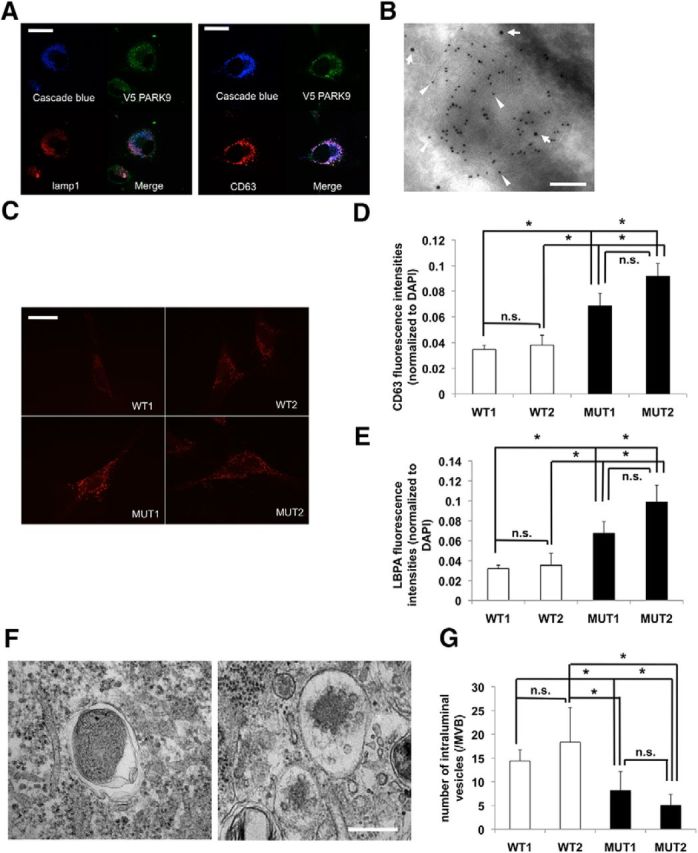
PARK9 localizes to MVBs. A, Left, Representative images of LAMP1 immunostaining of PARK9–V5-expressing neuroglioma H4 cells. A, Right, Representative images of CD63 immunostaining of PARK9–V5-expressing H4 cells. Cascade Blue-conjugated dextran was used for the late endosome-lysosome marker. Scale bar, 10 μm. B, Representative immuno-EM image of multivesicular body from PARK9–V5-expressing H4 cells. Double-staining was conducted using anti-CD63 antibody (10 nm gold particles, indicated by arrowheads) and anti-V5 antibody (15 nm gold particles, indicated by arrows). Scale bar, 50 nm. At least 30 cells from six sections were examined in three independent experiments. C, Representative images of CD63 immunostaining of two wild-type (WT) and two PARK9-mutant (MUT) fibroblast lines. Scale bar, 20 μm. D, Quantification of CD63 immunostaining intensity is shown after normalization to DAPI immunointensity (n = 3, *p < 0.03). E, Quantification of LBPA immunostaining intensity is shown after normalization to DAPI (n = 3, *p < 0.03). The values represent mean ± SEM from three independent experiments. F, Representative EM images of MVBs from WT (left) and MUT (right) fibroblasts from the examination of 20 cells/section in four sections. Scale bar, 100 nm. G, Quantification analysis of the number of ILVs in MBV from each fibroblasts (n = 30–50/cells, *p < 0.05). Data analysis was performed by one-way ANOVA and post hoc Tukey test.