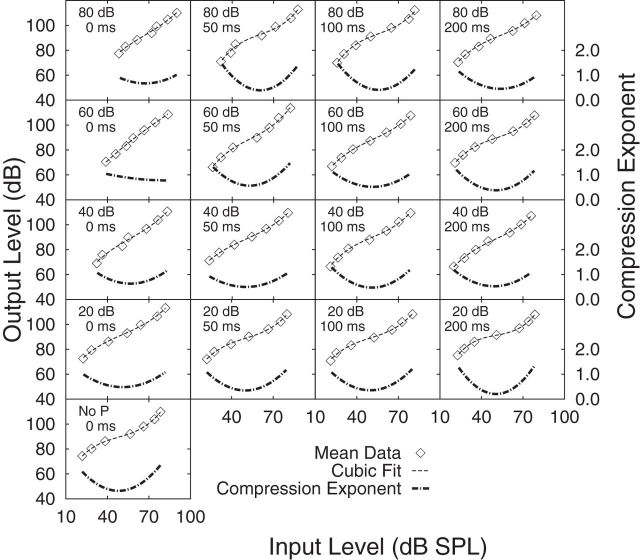
Figure 4.
Mean inferred BM response functions are presented. Unconnected open diamonds represent mean data points overlaid by a third-order polynomial fit to the mean (faint dashed line; left-hand y-axis). The compression exponent is the first derivative of the slope of the BM response function (thick dashed line; right-hand y-axis). Inferred BM response functions and compression exponents are presented for each of the 16 combinations of precursor level and precursor-masker silent temporal intervals. Increasing precursor level is shown in panels from bottom to top. Increasing precursor-masker silent temporal interval is shown in panels from left to right. The single panel at the bottom represents the mean data for the no-precursor (No P) condition. The mean SE per condition ranged from 1.7 to 4.2 (across the 16 precursor level and precursor-masker conditions) for the on-frequency masked thresholds and 2.8 to 3.9 for the off-frequency masked thresholds.

