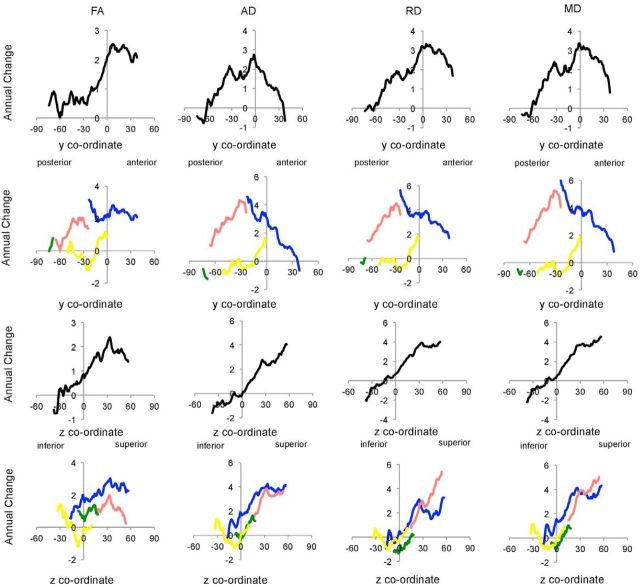
Figure 4.
Pattern of annual change: slice-by-slice profiles of mean t statistic. The mean, uncorrected, t statistic for analyses of annual change in FA, AD, RD, and MD is plotted for each coronal and axial slice within global (black), frontal (blue), parietal (pink), occipital (green), and temporal (yellow) ROI.

