Figure 2.

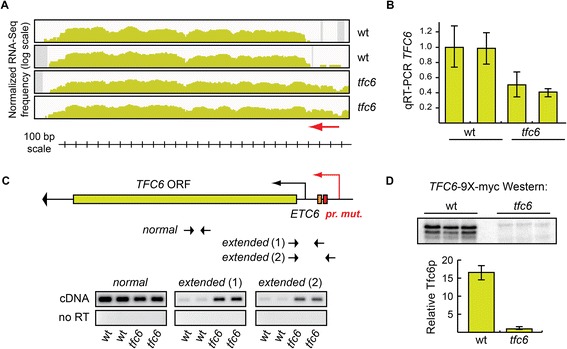
Tfc6 protein expression is reduced due to both transcriptional and translation defects in the promoter mutant strain. A) Integrative Genomics Viewer (IGV) transcription profile of the TFC6 gene region in wild type (DDY3 and DDY3630) and tfc6 mutant strains (DDY4300 and DDY4301, full strain genotypes are listed in Additional file 4: Table S7). All IGV profiles here and in subsequent figures are displayed on log scale, with the Y-axis representing normalized RNA-Seq frequency, and the X-axis the chromosomal region. The red arrow indicates the range of the extended 5′-UTR region in the mutants. B) Relative levels of TFC6 mRNA in each strain determined by qRT-PCR using primers within the coding sequence, and the same RNA samples used in the RNA-Seq library preparation. C) Schematic of the TFC6 gene and promoter region, showing the relative locations of the ETC6 site and the promoter mutation. The figure is drawn to scale and aligned with the IGV profile and scale bar in panel A) above. The large arrowhead at the end of the gene indicates the direction of transcription. RT-PCR was performed on the same RNA samples as in B) using primers specific to the normal (within the open reading frame) and 5′-UTR extended transcripts. Extended transcripts were highly enriched in the tfc6 mutant strains. D) Three independently isolated TFC6-9 × -myc tagged strains were constructed from wild type and tfc6 promoter mutants, and the relative levels of Tfc6 protein produced in each strain were determined by Western blotting. Quantitation of the Western blot signals showed an approximate 17-fold reduction in Tfc6p in the mutants.
