
Figure 5.
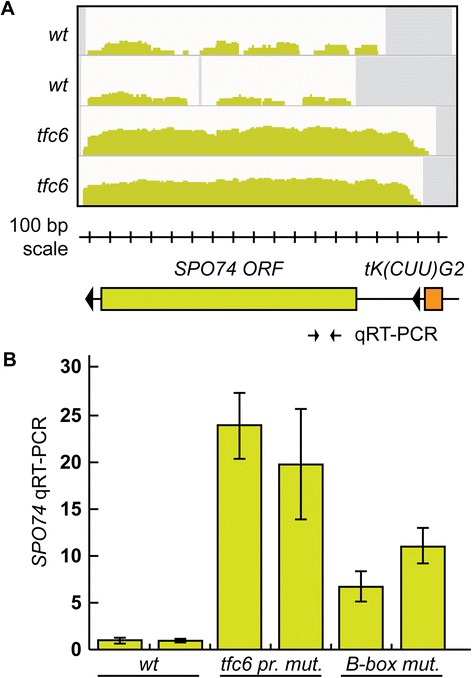
De-repression of SPO74 in tfc6 and B-box mutants. A) IGV profiles of SPO74 showing apparent de-repression. Schematic diagram showing the relative position of the upstream tDNA, drawn to scale with the IGV profiles. The location of the qRT-PCR primers is shown below the SPO74 ORF. B) Quantitative RT-PCR showing an increase in SPO74 RNA in tfc6 and B-box mutant strains relative to wild type. The B-box mutants were DDY5128 and DDY5129. IGV, integrative genomics viewer.