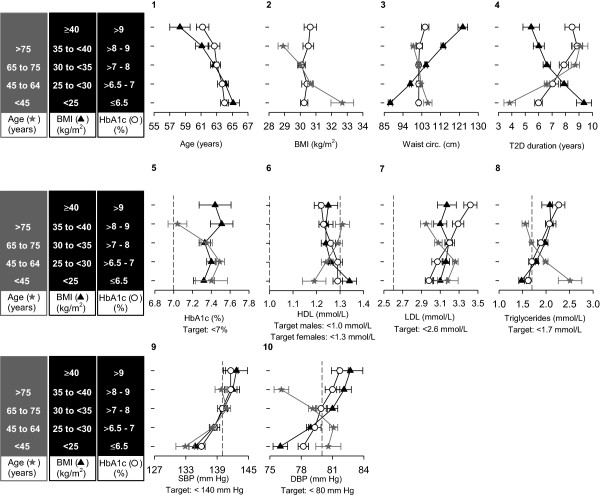
Figure 1.

Classic cardiovascular risk factors and other patient characteristics stratified by age, BMI, and HbA1c ranges. Values are means and 95% confidence intervals, calculated within the indicated strata of the dependent variables (age, BMI, and HbA1c). The vertical dotted lines in some charts represent target values recommended by the American Diabetes Association [8]. Stars = age; Triangles = BMI; Circles = HbA1c. Abbreviations: BMI, body mass index; DBP, diastolic blood pressure; FBG, fasting blood glucose; HbA1c, glycosylated hemoglobin; HDL, high-density lipoprotein; LDL, low-density lipoprotein; SBP, systolic blood pressure; T2D, type 2 diabetes.
