
Figure 5.
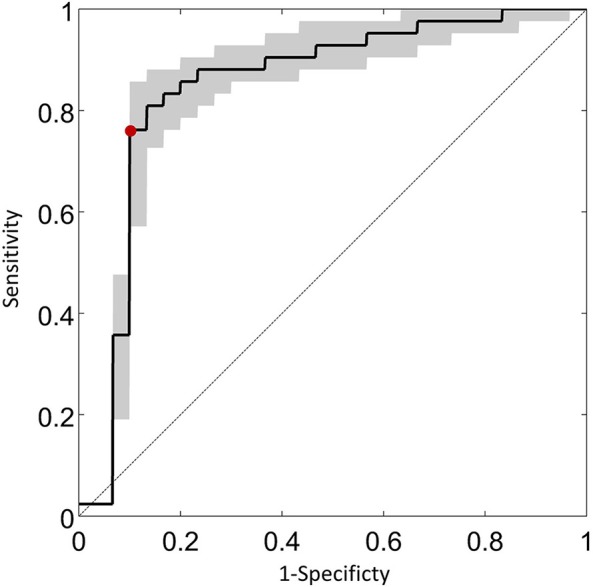
An ROC curve summarizing the classification potential of the methodology. The average sensitivity of the technique estimated (with 95% confidence intervals) at fixed specificity using all iterations for the entire sample of the data is shown on the vertical axis. The red symbol illustrates that the technique has a sensitivity of 76% (95% confidence interval of 58–86%) at 90% specificity. The diagonal line is the classification by chance.