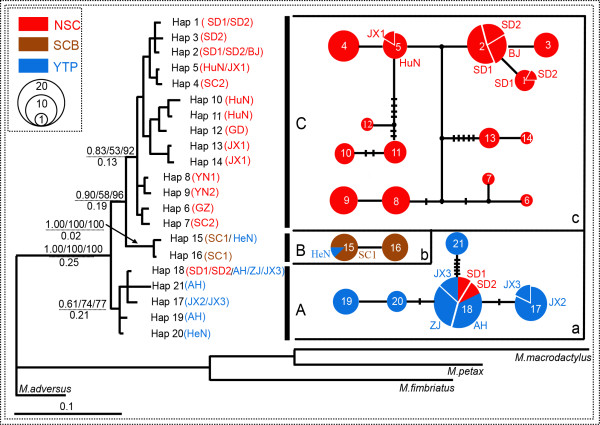
Figure 2.

Bayesian (BI) phylogenetic tree and TCS networks for Myotis pilosus based on mtDNA. Neighbour-joining (NJ), maximum likelihood (ML) and Bayesian (BI) methods resulted in concordant topologies with three major lineages (Clade A, B and C). Bootstrap values (BI/ML/NJ, above the line) above 50% and time of the most recent common ancestor (million years ago, below the line) were shown on major lineage nodes. The black dots represented missing steps between observed haplotypes. The short vertical bars referred to substitutions between haplotypes. Circle sizes were proportional to haplotype frequency (denoted in left upper corner). The haplotype numbers in networks were consistent with those in BI phylogenetic tree.
