Figure 3.

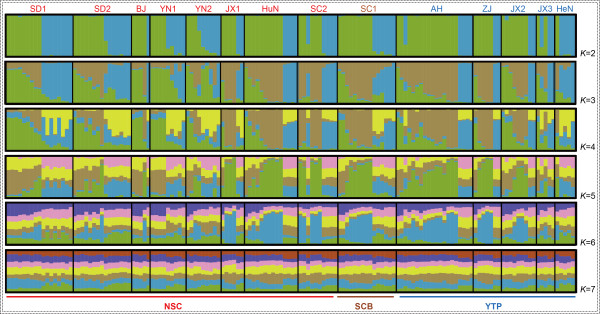
Bayesian clustering results (K = 2–7) performed in STRUCTURE for Myotis pilosus. The abbreviations of sampling localities were consistent with those in Table 1.

Bayesian clustering results (K = 2–7) performed in STRUCTURE for Myotis pilosus. The abbreviations of sampling localities were consistent with those in Table 1.