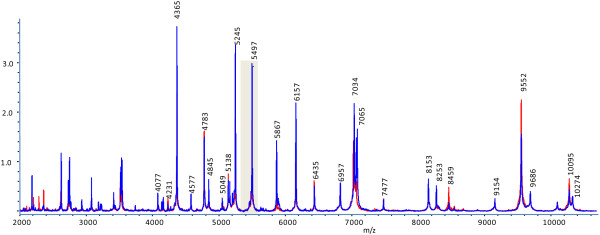
Figure 2.

Overlay of ICMS spectra (Overview of entire MALDI-TOF MS spectrum). General overview of the whole MALDI-TOF-MS spectrum of the C. jejuni strains NCTC 11168 (red) and 81-176 (blue). The numbers above the peaks indicate their m/z-value. The shaded area marks the mass range that is detailed in Figure 3.
