
Figure 4.
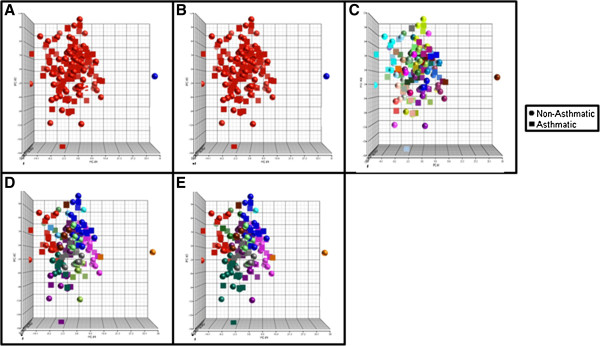
Scatterplots for each of the Gene Expression Clustering methods (Table2); A: Silhouette, B: Baker & Hubert, C: Hubert & Levine, D-E: Additional clustering Combinations. Colors are representative of individual clusters.
Official websites use .gov
A
.gov website belongs to an official
government organization in the United States.
Secure .gov websites use HTTPS
A lock (
) or https:// means you've safely
connected to the .gov website. Share sensitive
information only on official, secure websites.
Scatterplots for each of the Gene Expression Clustering methods (Table2); A: Silhouette, B: Baker & Hubert, C: Hubert & Levine, D-E: Additional clustering Combinations. Colors are representative of individual clusters.