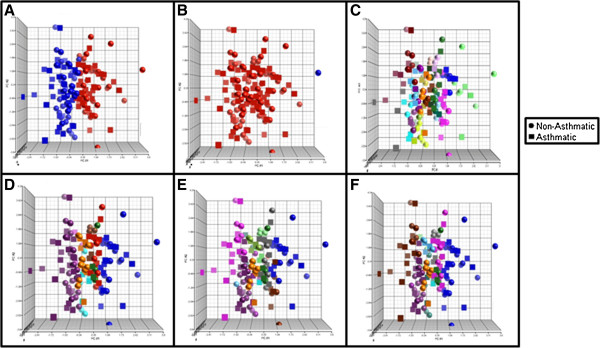
Figure 6.

Scatterplots for each of the 67 Clinical Covariate Clustering Methods (Table4); A: Silhouette, B: Baker & Hubert, C: Hubert & Levine, D: Prespecified cluster count = 11, E: Prespecified cluster count = 12, F: Prespecified cluster count = 14. Colors are representative of individual clusters.
