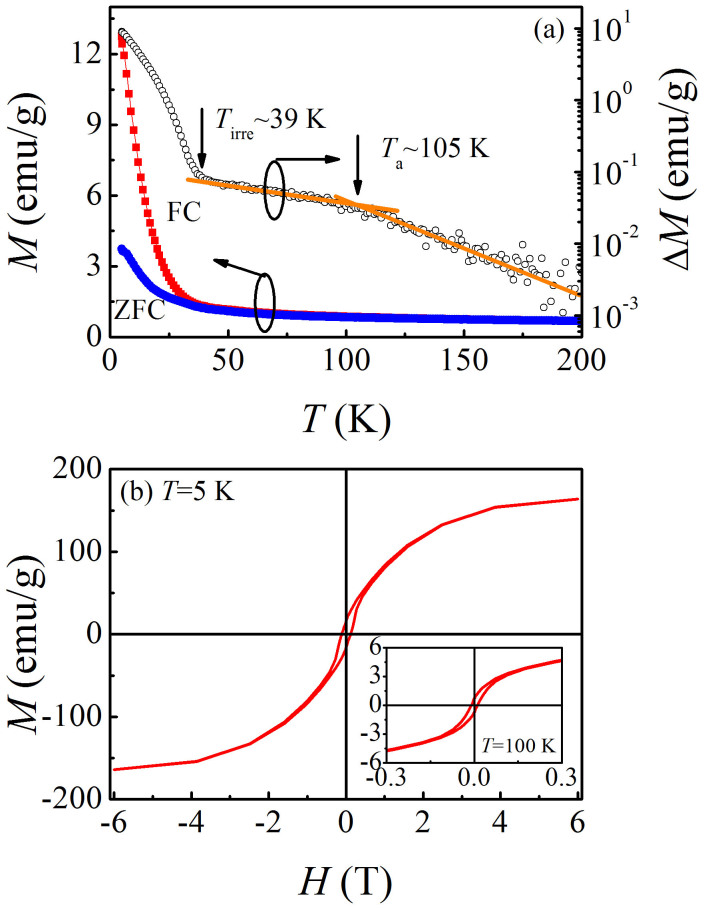
Figure 4.
(a) Temperature dependence of magnetization (magnetic contribution from substrate has been subtracted.) under FC and ZFC cases. The open circles represent the ΔM plotted as a function of T. Two possible phase transitions, Tirre and Ta, are indicated by the arrows, respectively. (b) M–H curves measured at T = 5 K (the main panel) and T = 100 K (the inset).

