
Figure 7. Comparison of random and risk-map based outbreaks for a single square mile of a medfly trapping network in Anaheim, CA.
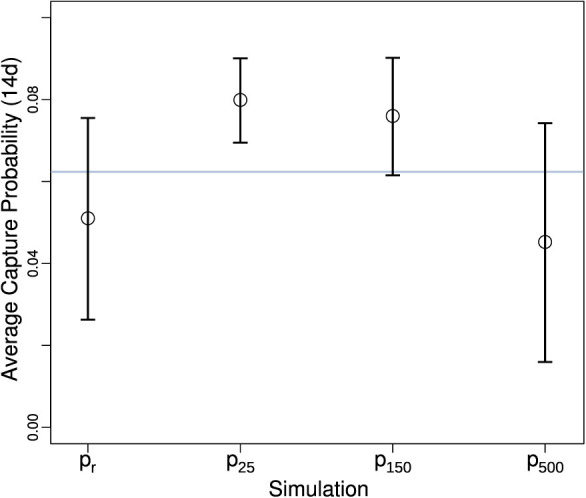
Bars show mean values, and whiskers indicate SD.  is the instantaneous estimate raised to the 14th power, indicated by the grey horizontal line; pr is the movement-based estimate with random outbreak locations; px indicate the probability of capture when outbreak locations are normally distributed and centered at the park (see Fig. 5) with x indicating the variance in outbreak location in meters.