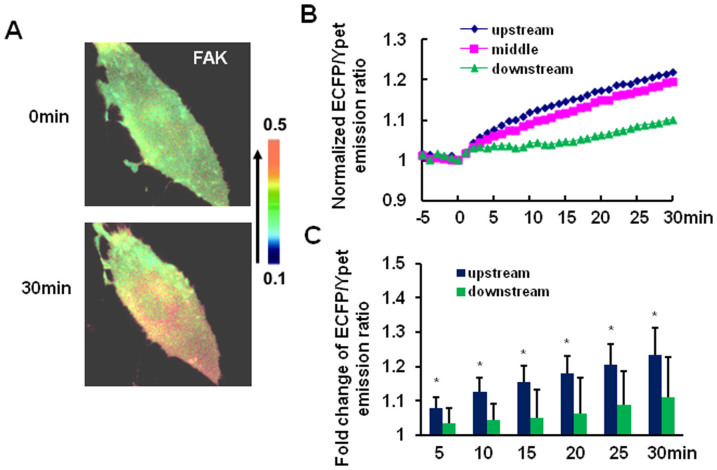
Figure 5. Laminar HSS caused a polarized FAK activation.
(A) The representative ECFP/YPet emission ratio images (left panels), (B) averaged time courses and (C) bar graphs (mean ± S.E.M.) represent the averaged values of the Lyn-FAK FRET biosensor to represent the FAK activation in different cell areas upon 30 min of HSS application (n = 20). * represents a statistically significant P < 0.05 when comparing the upstream and downstream area at the same point.

