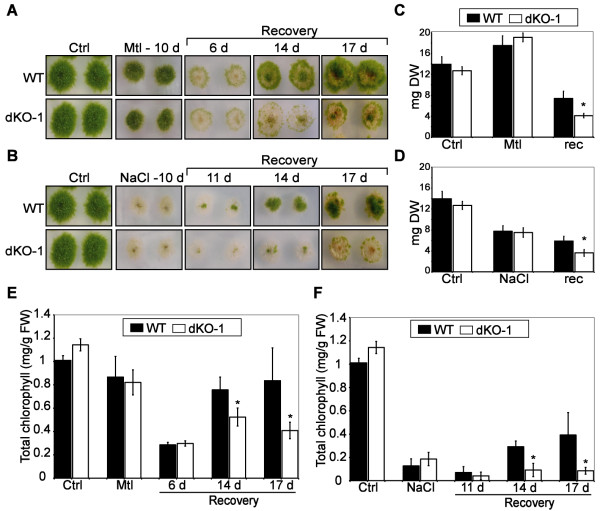
Figure 6.

Effect of osmotic and salt stress on P. patens wild type and knockout mutant. (A) Photograph images of WT and dKO-1 lines grown in optimal conditions (Ctrl), incubated for 10 days in plates supplemented with 900 mM mannitol (Mtl-10 d), and during 6, 14 and 17 days of recovery from osmotic stress. (B) Same as above but employing 500 mM NaCl as stressor and 11, 14 and 17 days of recovery. (C) Dry weight per colony in milligrams (mg) of controls (Ctl), plants stressed with 900 mM Mannitol for 10 days (Mtl) and plants allowed to recover from stress for 17 days (rec). (D) Same as (C) but using 500 mM NaCl as stressor. (E) Total chlorophyll content (mg/g/fresh weight) per colony from non-stressed controls (Ctrl), mannitol stressed plants (Mtl) and from plants allowed to recover from stress at the indicated time points in days. (F) Same as above but using NaCl as stressor. The values shown are means from one representative technical replicate. Error bars indicate SD (n = 15). Three biological replicates were carried out. Significant differences of at least 0.05 confidence level between the wild-type and the KO lines are marked by *.
