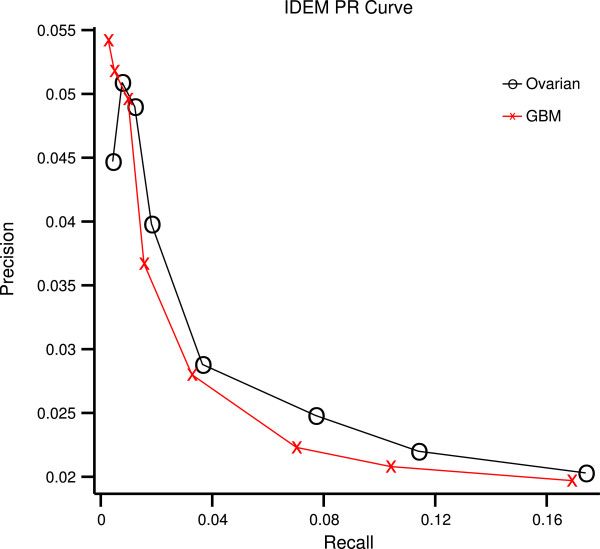
Figure 6.

PR curve. A PR curve produced as described in the “Knockdown validation” section, using the real ovarian and GBM data. At the far right of the curve, the observed precision approaches the null precision (or the precision expected if edges were placed randomly. Therefore, only the portion of the curve where the observed precision is noticeably above the null precision is shown.
