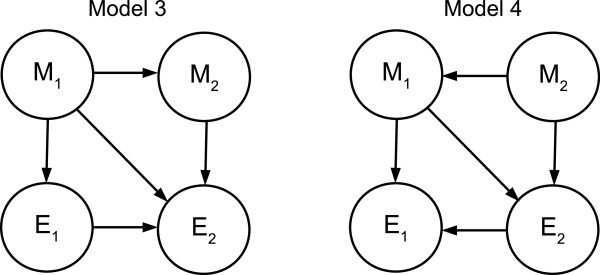
Figure 7.

Models 3, 4. Bayesian network graphs for Models 3 and 4. These are not causal graphs and are intended to represent possible effects of marginalizing over variables outside the subgraph {M1, M2, E1, E2} on the independence relationships among these variables.
