
. 2013 Nov 5;13:524. doi: 10.1186/1471-2407-13-524
Copyright © 2013 Skirnisdottir et al.; licensee BioMed Central Ltd.
This is an open access article distributed under the terms of the Creative Commons Attribution License (http://creativecommons.org/licenses/by/2.0), which permits unrestricted use, distribution, and reproduction in any medium, provided the original work is properly cited.
Figure 3.
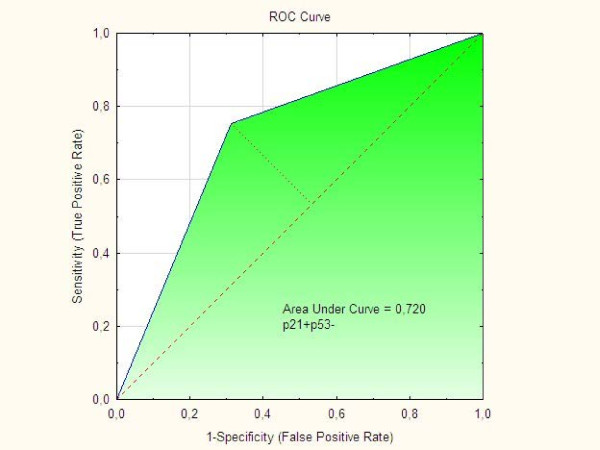
ROC curve for “p21 + p53- phenotype”.