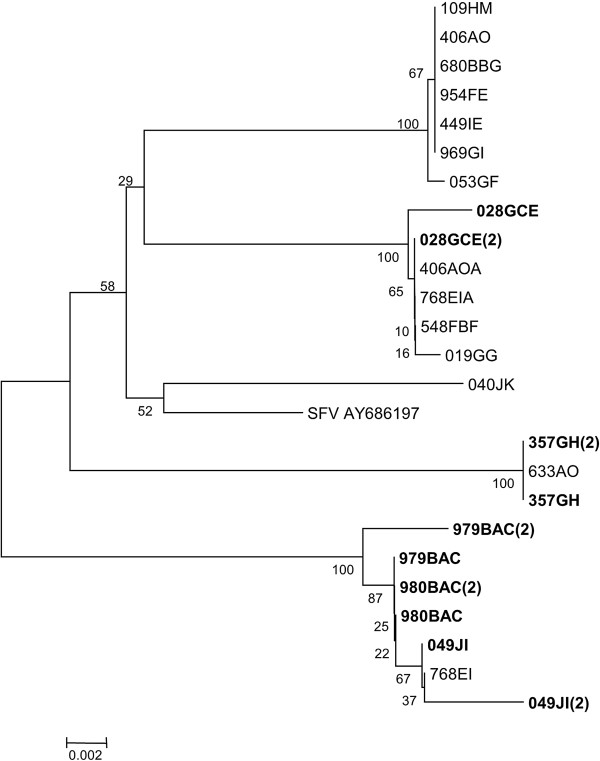
Figure 3.

SFV pol sequences in five macaques over time. The relationship between SFV pol sequences is shown for CA5 macaques to illustrate changes between two time points in five macaques (shown in bold). The evolutionary distances were calculated using the Neighbor-Joining method and are shown as the number of base substitutions per site. The percentage of replicates in which the sequences clustered together in the bootstrap test (10000 replicates) is shown next to the branches. Branches corresponding to partitions reproduced in less than 50% bootstrap replicates are collapsed. The tree is drawn to scale, with branch lengths in the same units as those of the evolutionary distances used to infer the phylogenetic tree. The evolutionary distances were computed using the Maximum Composite Likelihood method and are in the units of the number of base substitutions per site.
