Figure 5.

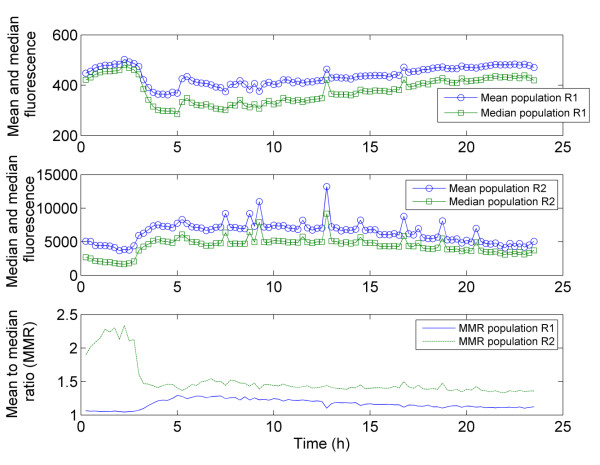
Evolution of the mean, median and MMR for PI uptake overall and for each subpopulation in the chemostat phase - R1 and R2 - separately. The gates R1 and R2 corresponds to those displayed on the dotplot of Figure 2.

Evolution of the mean, median and MMR for PI uptake overall and for each subpopulation in the chemostat phase - R1 and R2 - separately. The gates R1 and R2 corresponds to those displayed on the dotplot of Figure 2.