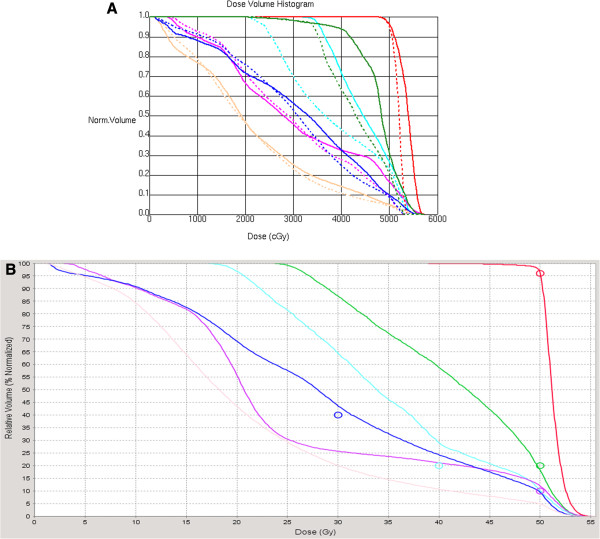
Figure 2.

Representative dose–volume histograms for (a) IMRT Vs VMAT-S, (b) tomotherapy. The curves of IMRT and Tomotherapy indicated in solid line, those of SmartArc indicated in dashed lines. The colors of the curves indicated as follows: red, PTV; forest, rectum; skyblue, bladder; purple, bowel; blue, pelvic bones; skin, normal tissue.
