
Figure 1.
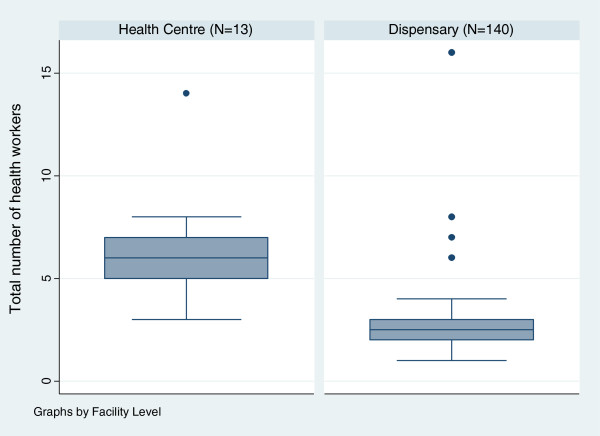
Box Plot showing the number of health providers employed at first-line health facilities, for health centres and dispensaries. (Boxes represent the data within the interquartile range (IQR) from the 25th to 75th percentile. The lines represent the range of the data (minus outliers that are data points that lay more than 1.5 fold above or below the IQR).