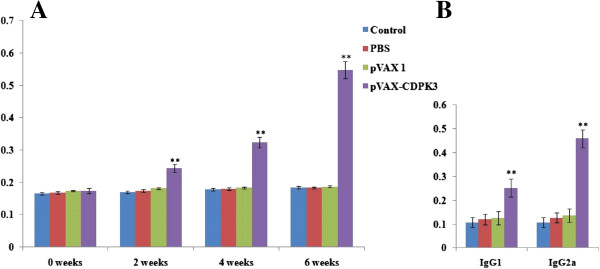
Figure 3.

Specific antibody response induced by DNA immunization with pVAX-CDPK3, pVAX I, PBS and blank controls using ELISA. (A) Determination of specific anti-TgCDPK3 IgG antibodies in the sera of Kunming mice at 0, 2, 4, and 6 weeks. (B) Determination of the specific anti-TgCDPK3 IgG subclass profile (IgG1 or IgG2a) in the sera of Kunming mice two weeks after the last immunization. Each bar represents the mean OD (±S.E., n = 3). Statistically significant differences of OD values (P < 0.05) are indicated by (**).
