Figure 2.

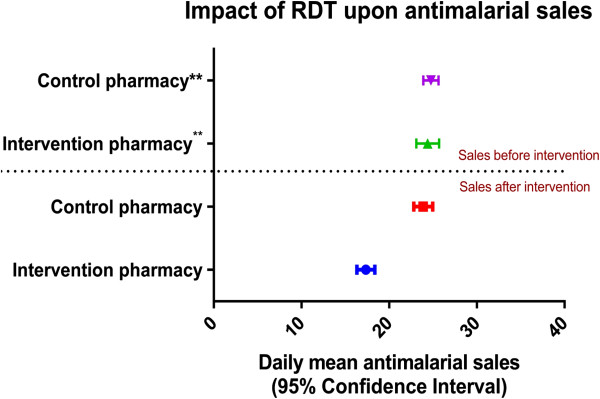
A box plot showing the total mean daily number of anti-malarial sales in the intervention and control pharmacy 35 days prior to the start of the study (Retrospective) and 35 days after the study commenced (Prospective).

A box plot showing the total mean daily number of anti-malarial sales in the intervention and control pharmacy 35 days prior to the start of the study (Retrospective) and 35 days after the study commenced (Prospective).