
Figure 11.
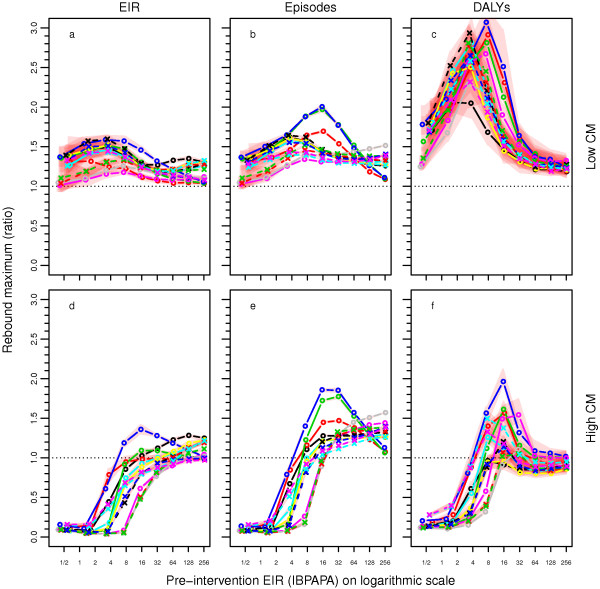
Maximum rebound after abruptly halting LLIN distributions, depending on CM and pre-intervention EIR. Maxima in the ratios of results after halting LLIN distribution after eight rounds (with a, b and c: low baseline CM and d, e and f scaled-up CM); and non-intervention scenarios (low CM only) calculated for means over the last 60 years of individual runs of 125 years, with 10 unique seeds per input EIR and model variant combination, for outcomes a and d: entomological inoculation rate (EIR): b, and e: episodes; and c and f: disability adjusted life years (DALYs). Lines connect median values of groups of the ten seeds with the same input EIR and model variant. See the legend of Figure 5 for model variant [12] colour coding. Red polygons show ranges. Note that if the rebound maximum is shown is below 1.0, it is possible that the maximum is not reached within 23 years post halting of LLIN distribution, and it is likely that in that case, the maximum is not larger than 1.0.