


Figure 2.
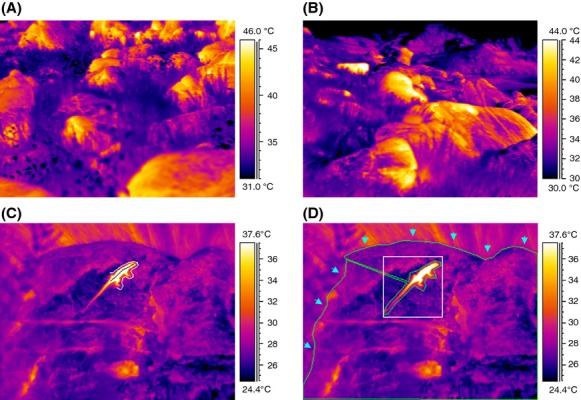
Thermograms of temperature microhabitats in the overall landscape (A–B) and analysis of lizard and environmental temperature (C–D). Measurement of lizard average temperature (line) and perch temperature (outline) is seen in (C). (D) Determination of maximum lizard temperature (box) and environmental maximum and minimum from the entire visible substrate available to the lizard. Only the rock surface (arrows indicate rock outline) was included in environmental analyses.