


Figure 6.
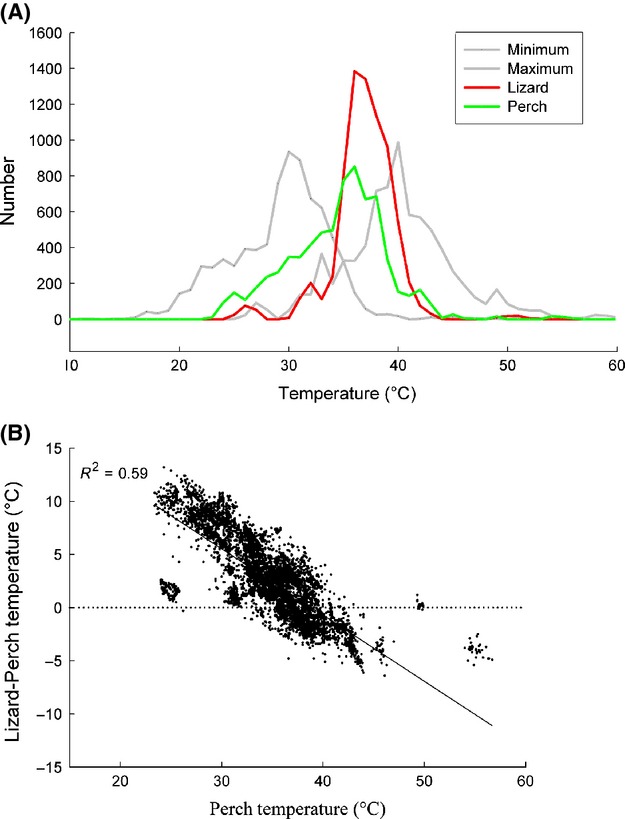
(A) Histogram showing the distribution of three environmental temperatures (perch, maximum, and minimum) and mean lizard body temperature. Lizard body temperature had the narrowest range, with a pronounced peak at 36–38°C, and was closer to maximum than to minimum temperature. (B) Perch temperature plotted against the difference between lizard mean body temperature and perch temperature. (Regression equation: Lizard – Perch T = 24.23 – 0.62 × Perch T; F = 9628; P < 0.0001).