


Figure 7.
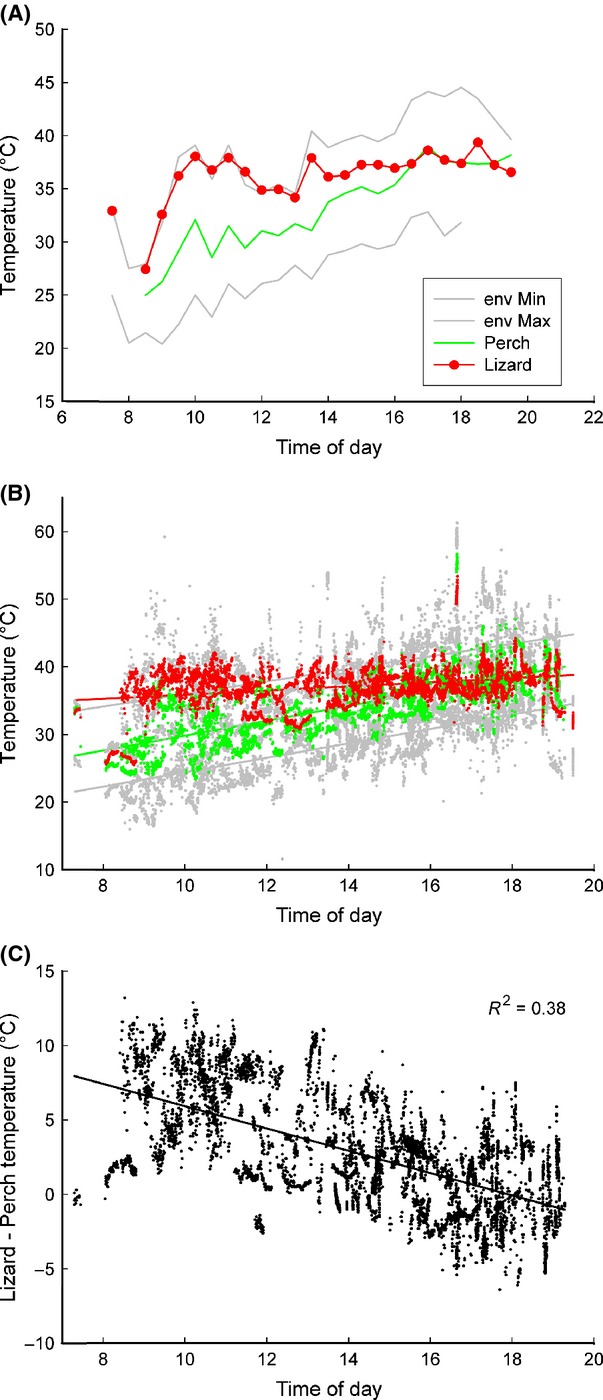
Temperature dynamics as a function of time of day, graphed as average temperature for every 30-min period (A) and all data points (B) and temperature difference (C). Slopes for temperatures (B) are as follows: Lizard T: slope = 0.3, R2 = 0.1; Min Env T: slope = 1.07; R2 = 0.51; Max Env T: slope = 0.93; R2 = 0.29; Perch T: slope = 1.1; R2 = 0.54. A small subset of values of lizard body temperature close to 50°C occurred over a 20-sec period, after which the lizard moved to deep shade. (C) Daily trends of the differences between lizard and perch temperature show that as environmental temperature increases over the course of the day perch temperature grows increasingly similar to body temperature.