


Figure 9.
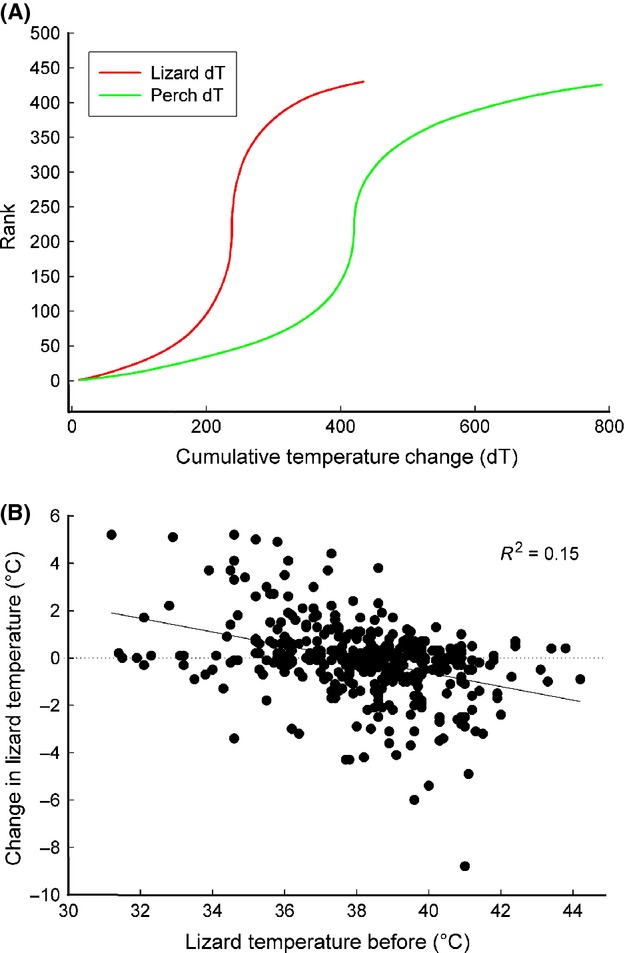
(A) Cumulative distributions of perch and lizard body temperatures illustrate the broader distribution of perch temperature change. (B) Lizard mean body temperature before the switch in position plotted against the change in body temperature (body temperature after – body temperature before).