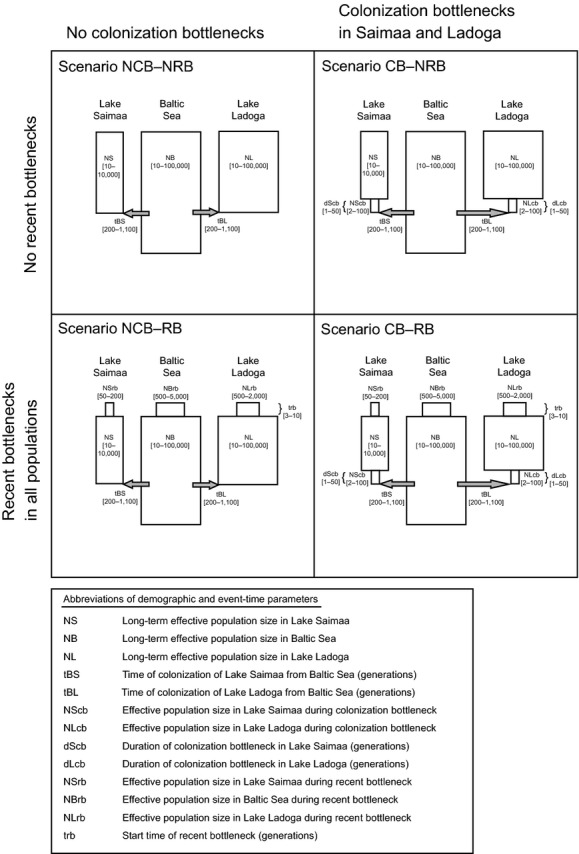
Figure 3.

Schematic illustration of the four hypothetical scenarios evaluated using approximate Bayesian computing (ABC), with the uniform prior ranges used for demographic and event-time parameters given in square brackets. Note that relative times and population sizes are not to scale.
