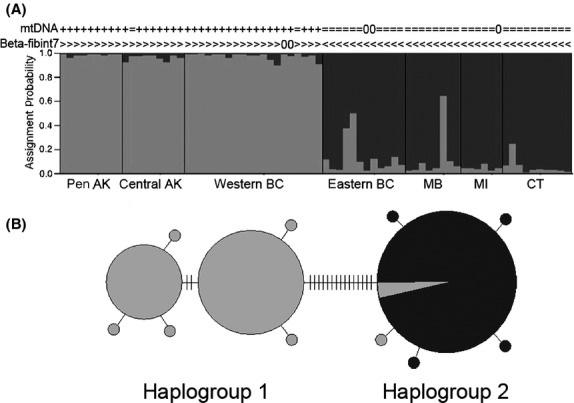
Figure 3.

Genetic results showing differentiation among seven hermit thrush populations. Sampling locations occur from west to east across the breeding range: peninsular and central Alaska (AK), western and eastern British Columbia (BC), Manitoba (MB), Michigan (MI), and Connecticut (CT) with the following sample sizes: n = 9, 9, 20, 12, 8, 6, and 10, respectively. (A) Probability of assignment for 74 individuals to two genetic clusters based on variation at six microsatellite loci. Western and eastern BC populations show high assignment probability to different clusters, despite close geographic proximity. Symbols above the structure plot indicate mtDNA haplotype (+ and = represent haplogroups 1 and 2, respectively) and β-fibint7 genotype (> and < represent genotypes AA and BB, respectively). The symbol 0 denotes no data for that individual. (B) Minimum-spanning network of 13 mitochondrial DNA haplotypes of ATPase (571 base pairs) distributed among 71 individuals. Gray shading denotes individuals from peninsular and central AK, and western BC; black shading denotes individuals from eastern BC, Manitoba, Michigan, and Connecticut. Overall, there is considerable geographic structuring, with 15 base pair changes separating the two haplogroups.
