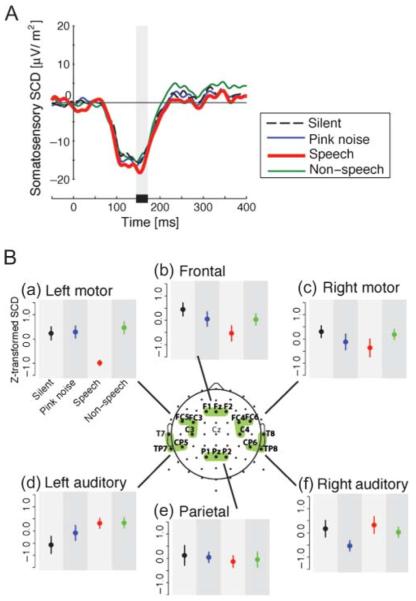
Figure 2.
Somatosensory scalp current density (SCD) due to facial skin stretch in four background sound conditions (speech, non-speech, pink noise, and silence). Panel A: Temporal pattern of somato-sensory SCD in the area above left motor and premotor cortex. Each color corresponds to a different background sound condition. The gray bar shows the time window for the calculation of the SCD amplitude measure. Panel B: Differences in z-score magnitudes associated with the first peak of the somatosensory SCD in each of six regions of interest. Error bars give standard errors across participants. Each color corresponds to different background sound conditions as in Panel A.

