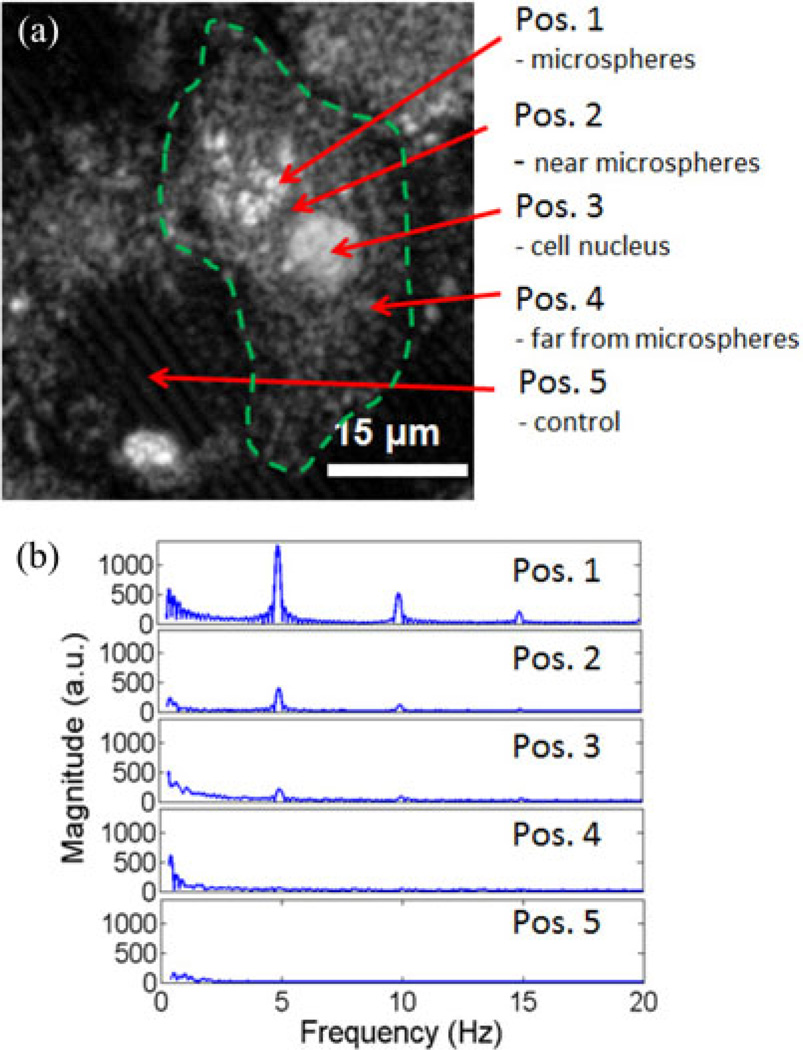
Fig. 2.
Phase-resolved MM-OCE from a single macrophage with phagocytosed microspheres. (a) OCM image of a single macrophage. Arrows indicate locations where M-mode magnetomotive measurements were made in and around the cell (dotted line approximates the contour of the cell). Protein-shell microspheres with a core suspension of magnetic nanoparticles in oil were custom-made in our lab for this experiment. (b) Frequency spectra of the cell displacement data show a response at the magnetic field modulation frequency, 5 Hz, as well as at weaker harmonic modes at 10 and 15 Hz. Positions correspond to those indicated in (a). The M-mode signal strength was strongest at the cluster of microspheres.

