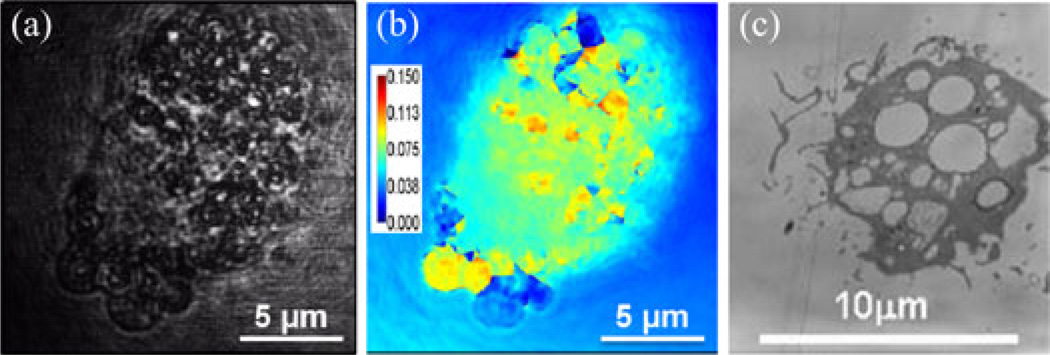
Fig. 3.
Validation of magnetomotive microspheres engulfed by macrophages. (a) Diffraction phase microscopy image of a macrophage exposed to magnetic microspheres, showing phagocytic inclusions of microspheres. (b) Spatial map of phase variance from a video-sequence of diffraction phase microscopy images collected during modulation of an applied magnetic field. Regions of high variance correspond to locations of microspheres. Color bar units are radians. (c) Transmission electron microscopy image of macrophages with engulfed microspheres.

