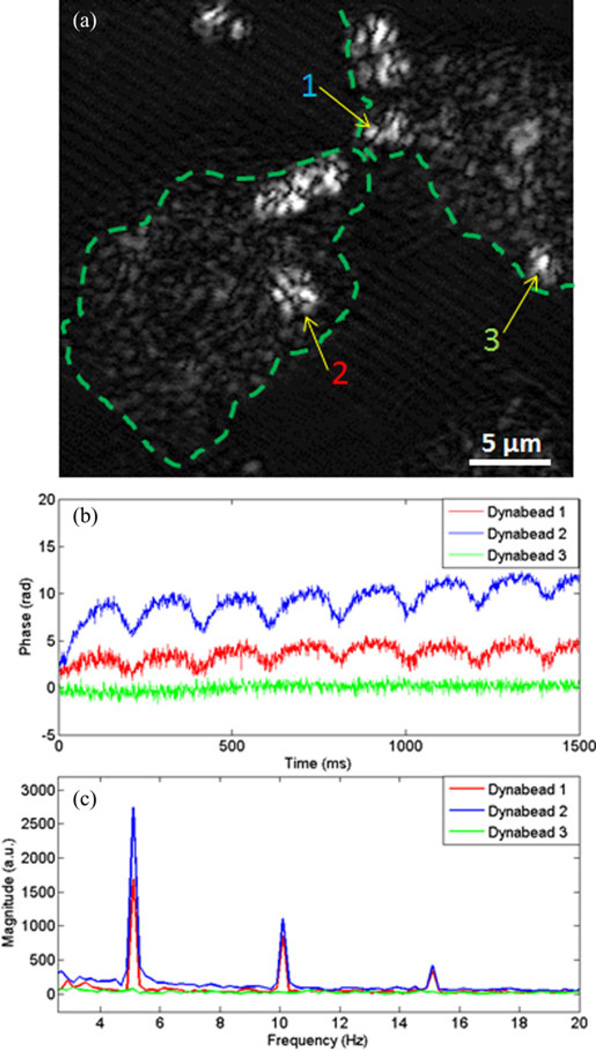
Fig. 7.
Magnetomotive response from cancer cells. (a) Representative OCM image of cancer cells (dotted line approximates cell contours) showing nontargeted Dynabeads (indicated by arrows) attached to the cells. M-mode magnetomotive signal data were taken at locations 1, 2, and 3. (b) Representative phase displacement responses of the cells at the locations of the Dynabeads indicated in part (a). The different amplitudes exemplify the variability of the signals from varying spatial positions on the cells. (c) The frequency spectra (via the Fourier transform) of the displacement signals plotted in (b) during 5-Hz modulation by the external magnetic field.

