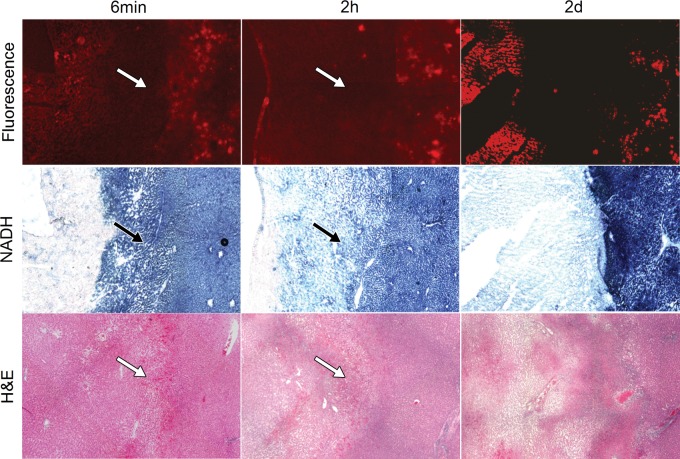
Figure 7:
Correlation of fluorescence images and NADH-stained images with hematoxylin-eosin–stained images at 6 minutes of ablation and 2 hours and 2 days after ablation. A hyperemic zone (arrows) was noted at observation time points during ablation and within 2 days after ablation. This zone appears as a lightly NADH-staining zone on NADH-stained images and as a DiI bubble–negative zone on fluorescence images. Original magnification, ×10.

