It is feasible to estimate patient-specific organ dose from patient size and the volume CT dose index for pediatric chest and abdominopelvic CT examinations; such information may aid in improved dose recording and monitoring, in dose estimation for multiple CT examination protocols across different CT scanners, in CT protocol optimization, and in the evaluation of dose profiles within a practice.
Abstract
Purpose
To estimate organ dose from pediatric chest and abdominopelvic computed tomography (CT) examinations and evaluate the dependency of organ dose coefficients on patient size and CT scanner models.
Materials and Methods
The institutional review board approved this HIPAA–compliant study and did not require informed patient consent. A validated Monte Carlo program was used to perform simulations in 42 pediatric patient models (age range, 0–16 years; weight range, 2–80 kg; 24 boys, 18 girls). Multidetector CT scanners were modeled on those from two commercial manufacturers (LightSpeed VCT, GE Healthcare, Waukesha, Wis; SOMATOM Definition Flash, Siemens Healthcare, Forchheim, Germany). Organ doses were estimated for each patient model for routine chest and abdominopelvic examinations and were normalized by volume CT dose index (CTDIvol). The relationships between CTDIvol-normalized organ dose coefficients and average patient diameters were evaluated across scanner models.
Results
For organs within the image coverage, CTDIvol-normalized organ dose coefficients largely showed a strong exponential relationship with the average patient diameter (R2 > 0.9). The average percentage differences between the two scanner models were generally within 10%. For distributed organs and organs on the periphery of or outside the image coverage, the differences were generally larger (average, 3%–32%) mainly because of the effect of overranging.
Conclusion
It is feasible to estimate patient-specific organ dose for a given examination with the knowledge of patient size and the CTDIvol. These CTDIvol-normalized organ dose coefficients enable one to readily estimate patient-specific organ dose for pediatric patients in clinical settings. This dose information, and, as appropriate, attendant risk estimations, can provide more substantive information for the individual patient for both clinical and research applications and can yield more expansive information on dose profiles across patient populations within a practice.
© RSNA, 2013
Introduction
From 1993 to 2006, the number of computed tomographic (CT) examinations performed in the United States increased at an annual rate of more than 10% (1). With this expanded use comes concern about elevated population risk of cancer incidences from CT radiation exposure (2). A particular concern has been the use of CT in the pediatric population (3), as children are not only more sensitive to radiation exposure than adults (4) but also have a longer life span during which the long-term effects of radiation may manifest (5). To develop strategies to optimize the radiation dose of CT studies and minimize the potential risk, it is valuable to obtain accurate patient dose estimates. Such data may enable improved dose recording and monitoring by including information pertaining to the specific patient, provide additional quantitative data for risk estimation, and aid in the optimization of CT protocols and practice performance.
A major issue with patient dose is that it cannot be characterized by a single metric. This is because of the fact that the deposition of energy in the body is heterogeneous and encompasses different organs of varying radiosensitivity. Dose distributed in each radiosensitive organ is generally regarded as one of the best metrics to characterize individual radiation burden. It is further used as the basis of radiation risk estimation (6). However, organ dose cannot be directly measured. As an alternative, patient dose is often indexed in terms of dose indicators such as the volume CT dose index (CTDI) (CTDIvol) and the size-specific dose estimate (SSDE). CTDIvol is highly limited as it reflects only the dose to uniform phantoms and is further naive to patient size (7). The recently proposed metric of SSDE addresses the latter limitation by incorporating the effects of patient size (8). SSDE thus represents a substantial improvement toward patient-specific dose estimation. However, it still relies on homogeneous phantoms and does not take into account the effects of tissue components and patient anatomy. Furthermore, in contrast to organ dose, which is a patient-specific biologic quantity, it pertains only to a specific imaging modality—that is, body CT.
Considering the importance of organ dose, it is important to devise a method to estimate it accurately. Because the individual patient organ dose cannot be directly measured, the reference standard for organ dose estimation is Monte Carlo computation, which simulates the x-ray photon transport through the body during the CT acquisition process. To be precise, however, the Monte Carlo simulation requires detailed modeling of (a) the CT scanner and (b) patient anatomy (9–11). The modeling of the CT scanner requires access to detailed, sometimes proprietary, information about the scanner (12), which is difficult but doable (13,14). However, modeling patient anatomy has remained a particular challenge. Most prior studies have been limited by the small number of computational phantoms used, which do not reflect the possible influence of anatomic variability across patients.
The purpose of this study, therefore, was to estimate organ dose from pediatric chest and abdominopelvic CT studies and evaluate the dependences of organ dose coefficients on patient size and scanner models. The CTDIvol-normalized organ dose coefficients were determined from Monte Carlo simulation by using representative pediatric patient models that included varying ages and weight percentiles. These coefficients provide quantitative data so that organ doses may be estimated with the knowledge of patient size and CTDIvol. The work was performed on the basis of common image acquisition protocols to devise a framework that can be applied to other protocols.
Materials and Methods
Our institutional review board determined that this retrospective study was in compliance with the Health Insurance Portability and Accountability Act and did not require patient informed consent.
This study was funded by the National Institutes of Health. The authors had complete control over the data and information submitted in this article.
Patient-specific Computer Models
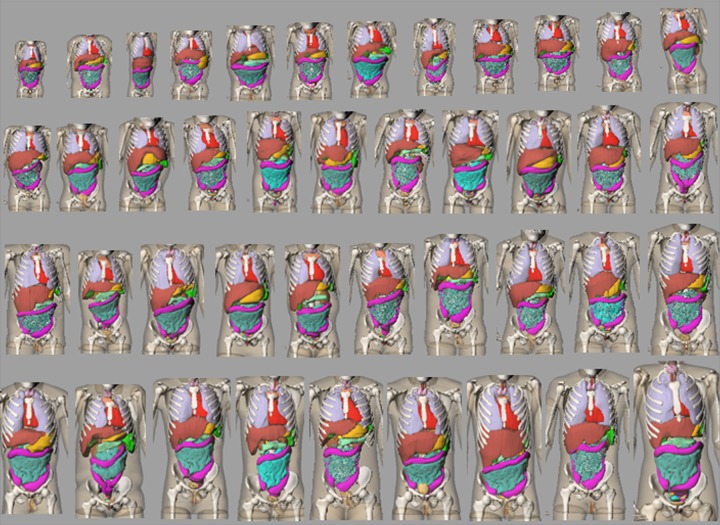
The study included 42 pediatric patients (age range, 0–16 years; mean age, 5 years ± 4 [standard deviation]; weight range, 2–80 kg; mean weight, 20 kg ± 14; trunk diameter range, 10–25 cm). There were 24 boys (age range, 0–12 years; weight range, 2–80 kg) and 18 girls (age range, 0–16 years; weight range, 2–41 kg). Each patient underwent a chest, abdominopelvic, or chest-abdominopelvic study at our institution for clinical purposes between October 2005 and November 2006. The studies were reviewed by a pediatric radiologist (D.P.F., with 20 years of experience) to ensure that these images were normal or contained findings that would not affect organ geometry, morphology, or other factors. Hence, the distribution of patient anatomy was representative of that in a healthy population. Images that contained lung parenchymal abnormalities, mediastinal abnormalities, and/or chest wall abnormalities were excluded. The distribution of patient ages and weight percentiles is shown in Figure 1. Using the CT data set of each patient as a basis, a full-body patient-specific model was created by using methods described previously (16,17). In brief, an initial phantom was first created by segmenting large organs and structures within the CT image volume. Three-dimensional triangulated polygon models were defined by applying the marching cubes algorithm for each organ mask. A three-dimensional nonuniform rational B-spline, or NURBS, surface was then fitted to polygon models by using NURBS modeling software (Rhinceros; McNeel North America, Seattle, Wash). Other organs and structures were defined by morphing structures from the Visible Human male or female full-body adult models (18,19). The volumes of the morphed organs or structures were checked and scaled, if necessary, to match age-interpolated organ volume and anthropometry data in International Commission on Radiological Protection Publication 89 (20). Frontal three-dimensional views of the patient models are shown in Figure 2.
Figure 1:
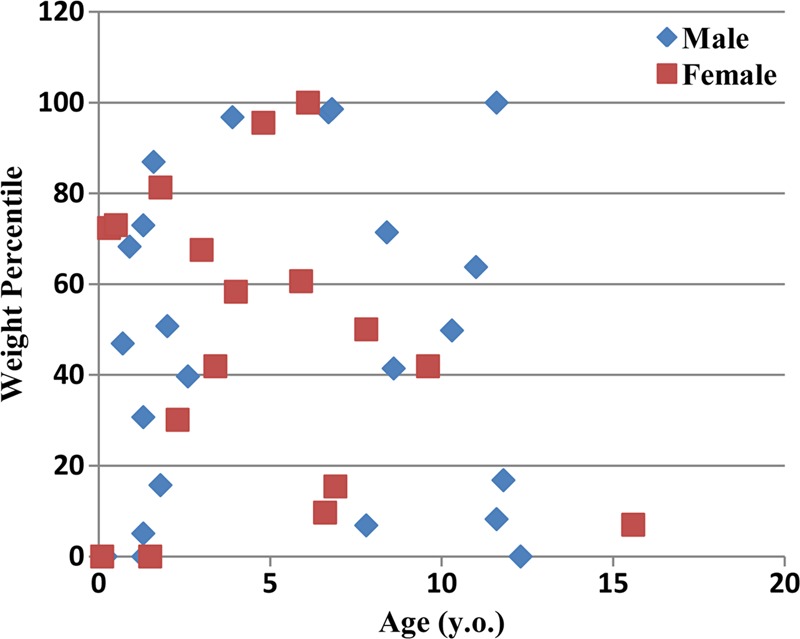
Graph shows weight percentiles, according to the Centers for Disease Control and Prevention (15), as a function of age for the 42 pediatric patients in this study.
Figure 2:
Three-dimensional frontal views of the series of patient models used in this study.
The full-body pediatric models consisted of 43 and 44 organs for male and female patients, respectively, including most of the radiosensitive organs defined by International Commission on Radiological Protection Publication 103 (21). All models were developed with 0.5- or 1-mm isotropic resolution for input into a Monte Carlo simulation.
CT Examination Simulations
In our previous study (17,22), we reported the development and validation of a Monte Carlo program for simulating dose with a 64-section CT system (LightSpeed VCT; GE Healthcare, Waukesha, Wis). The program was based on a benchmarked Monte Carlo subroutine package for photon, electron, and positron transport (PENELOPE, version 2006; Universitat de Barcelona, Barcelona, Spain) (23,24). The accuracy of the simulated dose was previously validated in cylindric and anthropomorphic phantoms for both axial and helical scanning modes (22).
In this study, the program was extended to simulate dose in a 128-section CT system (SOMATOM Definition Flash; Siemens Healthcare, Forchheim, Germany). The information about the scanner geometry, the spectrum of the x-ray source, and the materials and geometry of the bow tie filters was provided by the manufacturer. The modeling of the 128-section CT system was validated by using a custom-designed cylindric phantom. Simulation results were compared with measured values. The agreements were within −12% to +5%.
The simulations were performed by using the same tube potential and manufacturer-respective bow tie filters used for pediatric body CT and consistent collimation settings and pitch values (Table 1). The overranging distances were either determined from scanner console parameters (14) or were measured by using a ready-pack x-ray film (PPL; Eastman Kodak, Rochester, NY).
Table 1.
Summary of CT Protocols

Note.—A 16-cm-diameter CTDI phantom was used for all protocols.
Organ Dose Estimation
Monte Carlo simulations of helical CT studies were performed for patient phantoms for chest and abdominopelvic studies. The scan length was determined as the total image coverage plus the overranging distance. For a chest study, the image coverage was defined from 1 cm above the lung apex to 1 cm below the lung base. For an abdominopelvic study, the image coverage was defined from 1 cm above the liver anterior to 1 cm below the ischium.
Energy deposited in each key radiosensitive organ was tallied to calculate the organ dose. For the organs that were not explicitly modeled (the salivary glands, oral mucosa, and extrathoracic region), the doses were approximated by using doses to neighboring organs (pharynx and larynx). The organs were categorized into three groups with respect to their locations within the image coverage: organs within the image coverage, organs on the periphery of or outside the image coverage, and distributed organs (in this study, bone surface, red bone marrow, and skin).
CTDIvol-normalized organ dose coefficients were determined for each organ and were denoted as hO,S,P, where O is organ, S is scanner, and P is patient model. CTDIvol values were simulated in the Monte Carlo program, with the CTDI ion chamber (100 mm long, 3-cm3 active volume, model 10x5–3CT/9015; Radcal, Monrovia, Calif) and the polymethylmethacrylate phantom explicitly modeled. The 16-cm-diameter CTDI phantom was used for all protocols.
The relationships between CTDIvol-normalized organ dose coefficients and average patient diameter were determined by using nonlinear regression analysis. For chest CT studies, average chest diameter was calculated for each patient model with the following equation:
where V is the chest region volume and H is the chest region height. A similar method was used to calculate average abdominopelvic diameter for abdominopelvic CT studies.
The differences in CTDIvol-normalized organ dose coefficients between scanner models were analyzed in terms of the average, minimum, and maximum percentage differences among patient models. Considering the fact that large percentage differences might be less relevant if the absolute value of the organ dose is low, a difference ratio was further reported as the organ dose coefficient difference across scanner models divided by the total patient dose.
With an anticipated general similarity in CTDIvol-normalized organ dose coefficients between the two scanner models, exponential regressions were further fitted to the scanner-averaged coefficient for each organ as follows:
and
where  is the scanner-independent CTDIvol-normalized organ dose coefficient, Ns is the number of scanner models, and abd refers to the abdominopelvic region. The quantitative justification for the scanner-averaged fits was based on results provided in the following section. The CTDIvol-normalized organ dose coefficients were further compared with those in two published studies (13,14).
Results
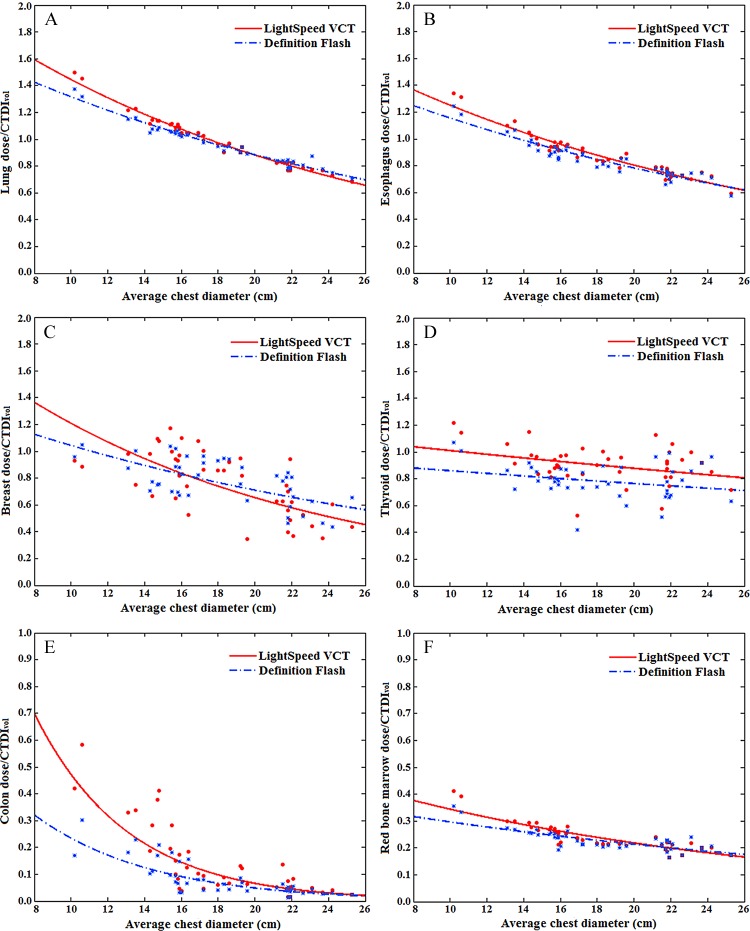
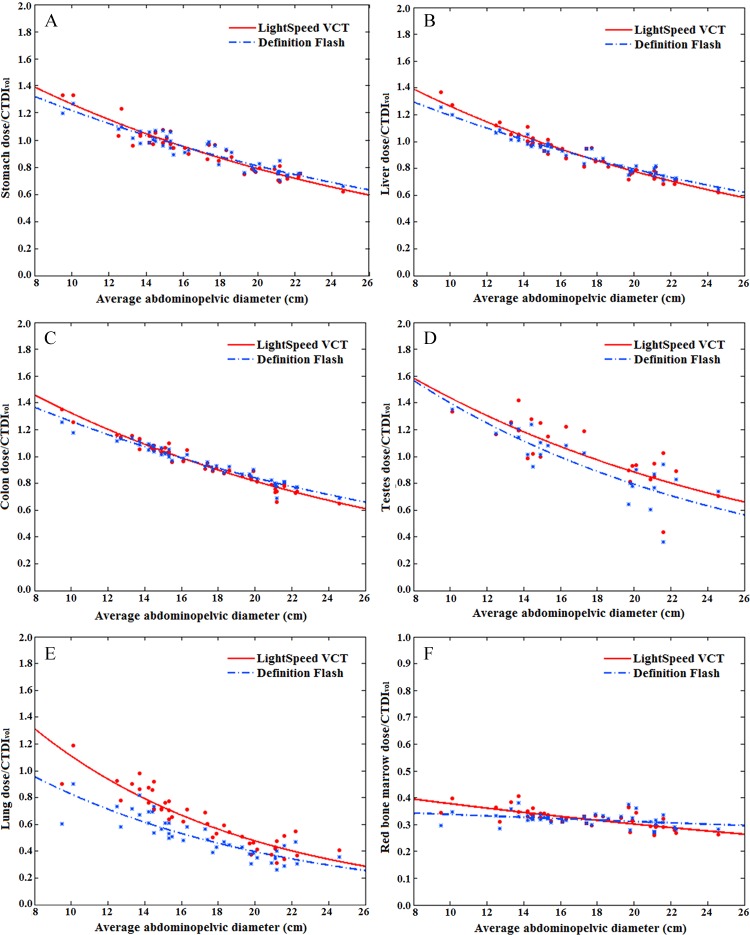
The CTDIvol-normalized organ dose coefficients showed an exponential relationship with average patient diameter. The relationship was dependent on the location and size of the organ. For large organs within the image coverage, the exponential relationships were strong (R2 > 0.9 for esophagus, lungs, and heart for chest studies; R2 > 0.9 for stomach, liver, and colon for abdominopelvic studies). Figures 3 and 4 show CTDIvol-normalized organ dose coefficients for 12 selected organs as a function of the average chest or abdominopelvic diameter.
Figure 3:
Graphs show example CTDIvol-normalized organ dose coefficients for chest studies plotted against the average chest diameter. (A, B) Graphs show coefficients for large organs within the chest image coverage. (C) Graph shows coefficients for small organs within the chest image coverage. (D, E) Graphs show coefficients for organs on the periphery of or outside the chest image coverage. (F) Graph shows coefficients for distributed organs. Fitting parameters are provided in Table 4.
Figure 4:
Graphs show example CTDIvol-normalized organ dose coefficients for abdominopelvic studies plotted against the average abdominopelvic diameter. (A–C) Graphs show coefficients for large organs within the abdominopelvic image coverage. (D) Graph shows coefficients for small organs within the abdominopelvic image coverage. (E) Graph shows coefficients for organs outside the abdominopelvic image coverage. (F) Graph shows coefficients for distributed organs. Fitting parameters are provided in Table 5.
For the comparison of the CTDIvol-normalized organ dose coefficients across two scanner models, the average, minimum, and maximum differences across patients are reported in Tables 2 and 3 for chest and abdominopelvic studies, respectively. For organs within the image coverage, the differences between scanner models were generally very small (average, within 4% for chest studies and 10% for abdominopelvic studies), except for the breasts (average, 24% for chest studies). For distributed organs and organs on the periphery of or outside the image coverage, the differences were generally larger (average, 3%–32%), possibly owing to the effect of the overranging distance. For chest and abdominopelvic studies, the difference ratios for all organs were within 1%.
Table 2.
Differences in CTDIvol-normalized Organ Dose Coefficients between Two CT Scanner Models for Chest Studies
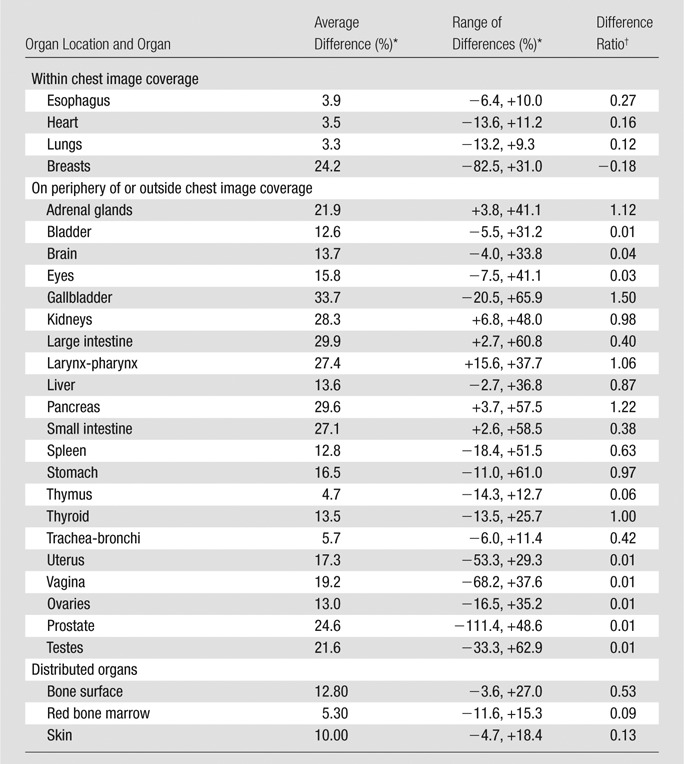
Note.—Range of differences refers to the minimum and maximum of organ dose differences across scanners. CT scanner models in this study included LightSpeed VCT (GE Healthcare) and SOMATOM Definition Flash (Siemens Healthcare).
For each patient model, the difference in CTDIvol-normalized organ dose coefficients (h factors) across scanner models was estimated as follows: (hO,S1,P − hO,S2,P)/hO,S1,P , where O is organ, S is scanner, and P is patient model. The average difference was calculated as  , where n is the number of patient models. The minimum and maximum percentage differences across patient models were further reported.
The difference ratio was calculated as  .
.
Table 3.
Differences in CTDIvol-normalized Organ Dose Coefficients between Two CT Scanner Models for Abdominopelvic Studies
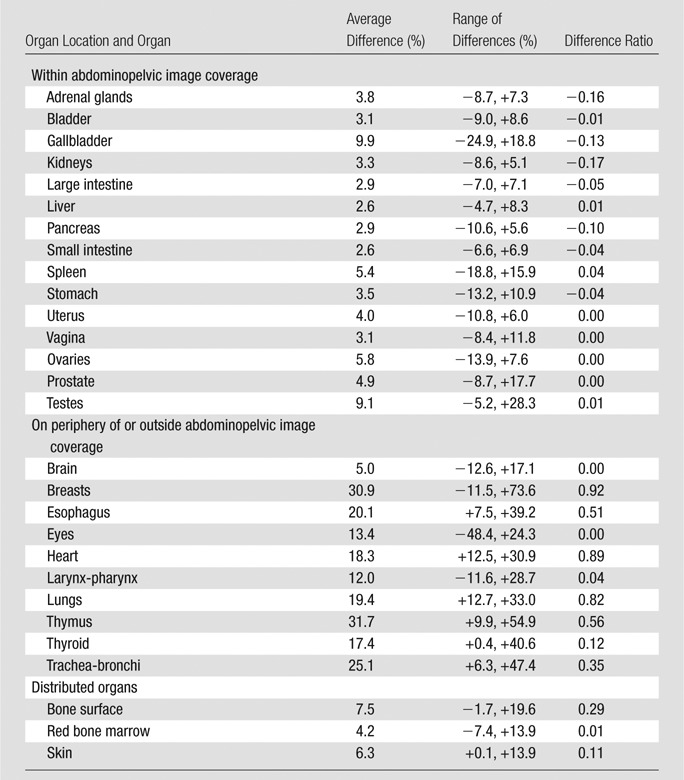
Note.—Range of differences refers to the minimum and maximum of organ dose differences across scanners. CT scanner models in this study included LightSpeed VCT (GE Healthcare) and SOMATOM Definition Flash (Siemens Healthcare). For descriptions of the calculation of average differences across scanner models and the difference ratio, please see the footnotes to Table 2.
Tables 4 and 5 provide fitting parameters αO,S and βO,S and R2 correlation coefficients for the exponential regression fits to CTDIvol-normalized organ dose coefficients for each scanner. For organs within the image coverage, the differences in dose coefficients for the two scanners were small (average, <10%), less than the achievable accuracy in the state-of-art dose estimation method (average, <11%) (22). Because organs within the image coverage receive the majority of the patient dose, we applied exponential fits to scanner-averaged organ dose coefficients. The resultant scanner-averaged fitting parameters αO and βO, R2 correlation coefficients, and root-mean-square of residuals for each organ are also reported in Tables 4 and 5 for chest and abdominopelvic studiess, respectively. The comparison of our results to those of prior studies (13,14) is illustrated in Figure 5.
Table 4.
Fitting Parameters, Correlation Coefficients, and Root-Mean-Square of Residuals for CTDIvol-normalized Organ Dose Coefficients for Chest CT Studies
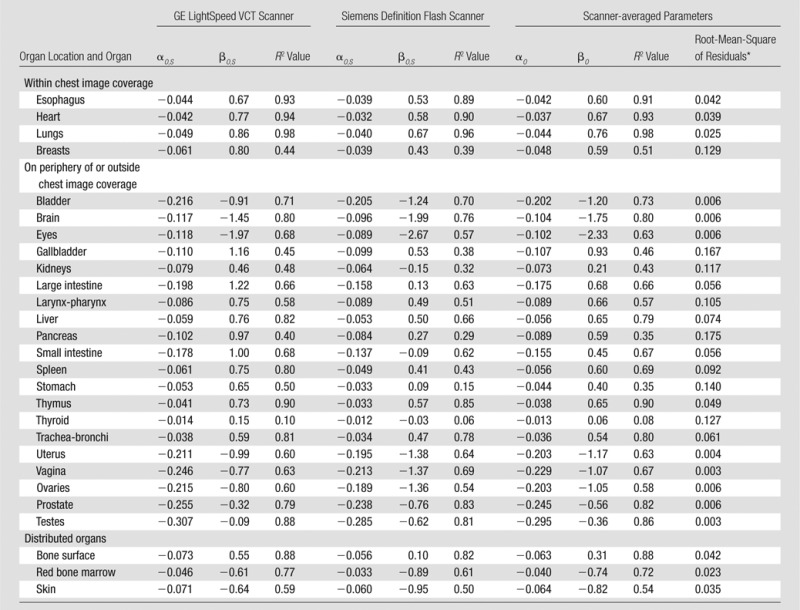
Note.—Both scanner-specific and scanner-averaged data are reported. The equation for CTDIvol-normalized organ dose coefficients for each scanner model was hO,S,P = exp (αO,S
dchest + βO,S). The equation for scanner-averaged CTDIvol-normalized organ dose coefficients was  . The organ dose coefficients
  and hO,S,P are unitless values (mGy-100 mAs per rotation/mGy-100 mAs). Normalization was performed by using a 16-cm-diameter CTDI phantom.
For each patient model, the root-mean-square of the residual was calculated as  , where
  was the estimated organ dose coefficient based on the exponential relationship using the fitting parameters αO and βO.
Table 5.
Fitting Parameters, Correlation Coefficients, and Root-Mean-Square of Residuals for CTDIvol-normalized Organ Dose Coefficients for Abdominopelvic CT Studies
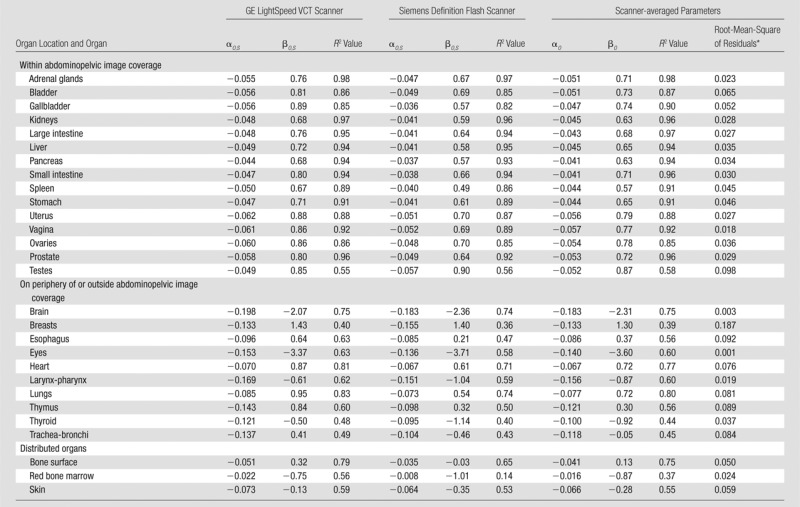
Note.—Both scanner-specific and scanner-averaged data are reported. The equation for CTDIvol-normalized organ dose coefficients for each scanner model was hO,S,P = exp (αO,S
dabd + βO,S). The equation for scanner-averaged CTDIvol-normalized organ dose coefficients was  = exp (αO,S
dabd + βO). The organ dose coefficients
  and hO,S,P are unitless values (mGy-100 mAs per rotation/mGy-100 mAs). Normalization was performed by using a 16-cm-diameter CTDI phantom.
For each patient model, the root-mean-square of the residual was calculated as  , where
  was the estimated organ dose coefficients based on the exponential relationship using fitting parameters αO and βO.
Figure 5:
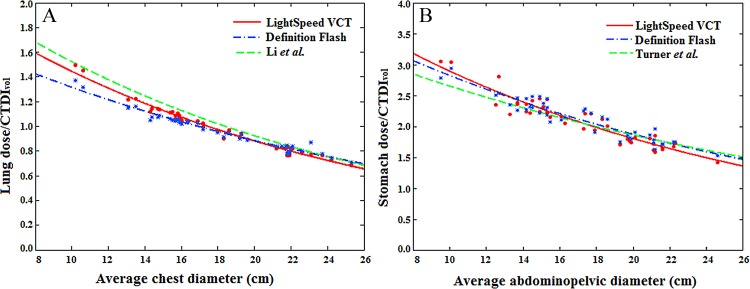
A, Graph shows comparison of CTDIvol-normalized lung dose coefficients for chest CT studies. Green curve = CTDIvol-normalized lung dose coefficients estimated by Li et al (14). Their protocol involved chest scanning, use of a GE LightSpeed VCT scanner, 120 kVp, 1.375 pitch, 40-mm collimation, and a small bow tie filter. B, Graph shows comparison of CTDIvol-normalized stomach dose coefficients for abdominopelvic CT studies. Green curve = CTDIvol-normalized stomach dose coefficients estimated by Turner et al (13). Their protocol involved abdominal scanning, the use of four 64-section multidetector CT scanners, 120 kVp, 1.0 pitch, the widest collimation setting available for each scanner, and bow tie filters for the adult body.
Discussion
In this study, we explored a patient-specific organ dose estimation technique for pediatric chest and abdominopelvic CT studiess using 42 patient models across two CT scanner models. The large number of models used in this study provides a representation of anatomic diversity across a patient population. This investigation of organ doses supports widely recognized needs. For example, in a recent summary of a National Institute of Biomedical Imaging and Bioengineering–sponsored Radiation Dose Summit (6), it was noted that, “...the entity we should be trying to estimate, record, and use as the basis for risk estimates is the radiation dose to individual radiosensitive organs…. Much work must be done here to develop meaningful, robust metrics of patient dose (eg, organ dose) that account for these many factors [eg, scanner variation] and attendant complexities.” During the 2011 Beebe symposium (25), it was emphasized that, “…if organ doses could be estimated reasonably accurately and robustly, then they would provide an extremely useful basis for estimating and tracking patient dose.” It was also noted that (25), “Doses to specific organs could be tracked over time and could be combined (added or by other math operation) in a much more meaningful way than we are currently able to do (eg, combining radiation dose indices such as CTDIvol and/or administered activity).” In our study, CTDIvol was not used as a metric of patient dose or organ dose; rather, it was used as an index of scanner radiation output. The normalized coefficients allowed organ doses to be derived with the knowledge of patient size and CTDIvol for a given CT examination in a given pediatric patient. Similar approaches are being implemented to estimate organ dose for the adult population. With a library of computational phantoms representing patients from newborn to adult (26), a comprehensive organ dose database is being established for patients with a diverse age distribution (27).
For chest studies, the CTDIvol-normalized organ dose coefficients reported in this study are in general agreement with the results of Li et al (14). For the lungs, esophagus, and heart, differences in organ dose coefficients between the two studies were less than 10%. For abdominopelvic studies, we compared our results with those of Turner and colleagues (13). Because abdominal and abdominopelvic studies are designed to cover different body regions, the start and end locations for the two protocols are defined based on different body landmarks. To avoid the differences in coefficients caused by that effect, comparisons were performed only for organs that are fully irradiated in both studies (liver, stomach, adrenal glands, kidney, pancreas, spleen, and gallbladder). In the study of Turner et al (13), organ dose values were normalized on the basis of CTDIvol measured by using the 32-cm CTDI phantom. With adjustment for the size of the CTDI phantom, our results again showed excellent agreement with the results of Turner et al (< 10% difference).
The exponential regression models are generally found to be sufficient to describe the relationship between organ dose and patient size (13,14). This can be explained by the physical principle that dose contributed by the primary beam is exponentially related to patient attenuation. Theoretically, the organ dose contributed from the primary beam can be modeled as an exponential function of the tissue attenuation property and the path length the photon transverses. We explicitly modeled the energy-dependent linear attenuation coefficients and the transmission of every photon, integrated across a multiplicity of photons and pathways. Furthermore, because patient attenuation is generally proportional to patient size for a specific region (chest or abdominopelvic region), we used the physically justified exponential model to provide a simplified way to assess organ dose on the basis of patient size.
Beyond exploring the relationships between CTDIvol-normalized organ dose coefficients and patient size, our study further explored the feasibility of deriving scanner-independent organ dose coefficients. It was previously reported by Turner et al (28) that the differences in CTDIvol-normalized organ dose values across scanner models are very small (within 8.5%). However, those simulations were based on a pitch of 1.0 and a whole-body CT protocol. In our study, larger differences were found between scanner models. One possible reason for the larger differences is that when only part of the body is directly irradiated, organ dose can vary depending on how much of the organ volume is under the direct radiation beam. The two scanner models differed in overranging distances, resulting in a difference in the total scan length for the same patient. This further leads to larger differences in CTDIvol-normalized organ dose coefficients, particularly for distributed organs and organs on the periphery of or outside the image coverage. This effect can be larger for pediatric patients, for whom overranging distance accounts for a larger percentage of the total scan length. Second, the pitch values modeled in our study were larger than 1.0. With pitch values larger than unity, the beam separations between different rotations of the helical study could lead to a nonuniform dose distribution in the z direction. This effect is more prominent for small organs (breasts for chest studies), as the size of the organ would be relatively small compared with the beam separations between two helical rotations.
Many factors contribute to patient dose, including (a) the scanner output radiation, (b) patient characteristics, and (c) the relative locations of the regions of interest and the x-ray beam. A comprehensive dose estimation method should precisely model all three factors. As discussed earlier, CTDIvol is a widely used index to quantify scanner radiation output but cannot adequately measure the other two factors. The SSDE aims to address the second factor by taking one important patient attribute (patient size) into account. However, SSDE is still naive to tissue components and patient internal anatomy. Thus, it can be regarded as a straightforward but anatomy-generic method to estimate average dose distributed within the cross-sectional volume of the patient. As for the third factor, because SSDE is estimated in the center of the scanned region, it can be applied only to regions that are fully irradiated during the CT examination.
An example of the accuracies of CTDIvol and SSDE in approximating organ dose is provided in Table 6. The abdominopelvic CT examination was performed for a 12-year-old male patient. The CTDIvol for the examination (based on a 16-cm-diameter CTDI phantom) was 4.26 mGy. Given that child’s average abdominopelvic diameter of 21 cm, the SSDE associated with this examination was 3.53 mGy. As shown, for organs within the image coverage, CTDIvol overestimated organ doses with discrepancies ranging from 7% to 44%. SSDE provided more accurate dose estimations, with discrepancies ranging from −11% to 20%. As discussed earlier, such discrepancies are primarily introduced by patient internal anatomy and organ distributions.
Table 6.
Comparison between CTDIvol, SSDE, and Patient-specific Organ Dose for an Abdominopelvic CT Study
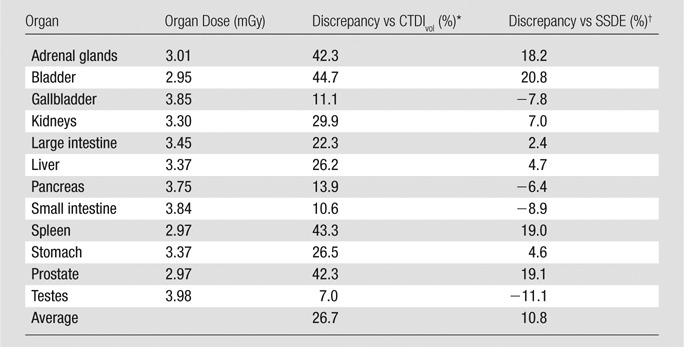
Note.—The comparison was based on an abdominopelvic CT study in a 12-year-old male patient. The CTDIvol for the examination (based on a 16-cm-diameter CTDI phantom) was 4.26 mGy. Given that the child’s average abdominopelvic diameter was 21 cm, the SSDE associated with this study was 3.53 mGy.
Discrepancies between CTDIvol and organ dose were calculated as (CTDIvol − organ dose)/organ dose.
Discrepancies between SSDE and organ dose were calculated as (SSDE − organ dose)/organ dose.
To quantify the third factor that determines patient dose, we estimated the contribution of partially irradiated organ doses to whole-body dose. In the example above, the sum of doses of partially irradiated organs contributed 25% to the whole-body dose. Heart dose and lung dose were 2.69 and 1.75 mGy, respectively. Such magnitudes are comparable to dose received by fully irradiated organs. Considering such nonnegligible amounts of dose, close attention should be paid when applying SSDE as a surrogate of organ dose.
Our study had several limitations. First, it was based on CT scanners from two manufacturers only, although they represent devices with wide clinical penetration (>60% of worldwide market share in 2010) (29). Additionally, the good agreement between our results and those of other investigators (based on different scanner models) further strengthens the generalizability of our findings. Second, owing to the extensive effort required to develop computational phantoms, the number of patient models encompassing ages 12–18 years was limited. Nevertheless, to the best of our knowledge, this study still represents the largest database for pediatric organ dose estimates. Third, our study did not specifically address nuances associated with tube current modulation (30), bismuth shielding (31), or organ-based dose modulation (32), topics that we aim to adddress in future studies. Fourth, in a direct application of our coefficients to assess the organ doses for a real patient undergoing a CT examination, certain sources of error included the following: organ size and distribution mismatch between the phantoms and the patient, variation in patient positioning, and uncertainty in the start and end position of the scan region. These potential errors may be addressed only with phantom models that are specific to each individual patient. Finally, our scanner-averaged coefficients, while generalizable for organs within the image coverage, may not be as applicable to distributed organs and organs on the periphery of or outside of the image coverage. Developing scanner-specific conversion coefficients might be necessary for these organs.
In summary, it is feasible to estimate patient-specific organ dose from patient size and the CTDIvol for pediatric chest and abdominopelvic CT examinations. Such information may aid in improved dose recording and monitoring, in dose estimation for multiple CT examination protocols across different CT scanners, in CT protocol optimization, and in the evaluation of dose profiles within a practice.
Advances in Knowledge
■ In pediatric chest and abdominopelvic CT, organ dose decreases exponentially with increasing patient size, governed by parameters that are specific to each organ.
■ Volume CT dose index (CTDIvol)-normalized organ dose may be used as a scanner-independent metric for estimation of dose in organs within the image coverage.
Implications for Patient Care
■ Patient-specific organ dose in clinical settings can be estimated by using CTDIvol-normalized organ dose coefficients, as reported in this study based on 42 patient models encompassing newborns to teenagers.
■ Patient-specific organ dose estimates allow detailed dose recording and monitoring (including practice dose profiles), as well as radiation risk estimation.
Received November 25, 2012; revision requested January 23, 2013; revision received June 20; accepted July 25; final version accepted August 1.
Funding: This research was supported by the National Institutes of Health (grant RO1EB001838).
Disclosures of Conflicts of Interest: X.T. No relevant conflicts of interest to disclose. X.L. No relevant conflicts of interest to disclose. W.P.S. No relevant conflicts of interest to disclose. E.K.P. Financial activities related to the present article: none to disclose. Financial activities not related to the present article: has served as an expert witness; owns stock or stock options in Zonare. Other relationships: none to disclose. D.P.F. No relevant conflicts of interest to disclose. E.S. Financial activities related to the present article: received grants from Siemens and GE Healthcare. Financial activities not related to the present article: has received a grant from Carestream. Other relationships: none to disclose.
Abbreviations:
- CTDI
- CT dose index
- CTDIvol
- volume CTDI
- SSDE
- size-specific dose estimate
References
- 1.National Council on Radiation Protection and Measurements . Ionizing radiation exposure of the population of the United States. NCRP Report No 160. Bethesda, Md: National Council on Radiation Protection and Measurements, 2009. [Google Scholar]
- 2.Hricak H, Brenner DJ, Adelstein SJ, et al. Managing radiation use in medical imaging: a multifaceted challenge. Radiology 2011;258(3):889–905. [DOI] [PubMed] [Google Scholar]
- 3.Pearce MS, Salotti JA, Little MP, et al. Radiation exposure from CT scans in childhood and subsequent risk of leukaemia and brain tumours: a retrospective cohort study. Lancet 2012;380(9840):499–505. [DOI] [PMC free article] [PubMed] [Google Scholar]
- 4.National Research Council . Health risks from exposure to low levels of ionizing radiation: BEIR VII. Washington, DC: National Academies Press, 2006. [PubMed] [Google Scholar]
- 5.Brenner D, Elliston C, Hall E, Berdon W. Estimated risks of radiation-induced fatal cancer from pediatric CT. AJR Am J Roentgenol 2001;176(2):289–296. [DOI] [PubMed] [Google Scholar]
- 6.Boone JM, Hendee WR, McNitt-Gray MF, Seltzer SE. Radiation exposure from CT scans: how to close our knowledge gaps, monitor and safeguard exposure—proceedings and recommendations of the Radiation Dose Summit, sponsored by NIBIB, February 24-25, 2011. Radiology 2012;265(2):544–554. [DOI] [PMC free article] [PubMed] [Google Scholar]
- 7.McCollough CH, Leng S, Yu L, Cody DD, Boone JM, McNitt-Gray MF. CT dose index and patient dose: they are not the same thing. Radiology 2011;259(2):311–316. [DOI] [PMC free article] [PubMed] [Google Scholar]
- 8.American Association of Physicists in Medicine . Size-specific dose estimates (SSDE) in pediatric and adult body ct examinations (Task Group 204). College Park, Md: American Association of Physicists in Medicine, 2011. [Google Scholar]
- 9.Lee C, Kim KP, Long DJ, Bolch WE. Organ doses for reference pediatric and adolescent patients undergoing computed tomography estimated by Monte Carlo simulation. Med Phys 2012;39(4):2129–2146. [DOI] [PMC free article] [PubMed] [Google Scholar]
- 10.Ding A, Mille MM, Liu T, Caracappa PF, Xu XG. Extension of RPI-adult male and female computational phantoms to obese patients and a Monte Carlo study of the effect on CT imaging dose. Phys Med Biol 2012;57(9):2441–2459. [DOI] [PMC free article] [PubMed] [Google Scholar]
- 11.Gu J, Bednarz B, Caracappa PF, Xu XG. The development, validation and application of a multi-detector CT (MDCT) scanner model for assessing organ doses to the pregnant patient and the fetus using Monte Carlo simulations. Phys Med Biol 2009;54(9):2699–2717. [DOI] [PMC free article] [PubMed] [Google Scholar]
- 12.Turner AC, Zhang D, Kim HJ, et al. A method to generate equivalent energy spectra and filtration models based on measurement for multidetector CT Monte Carlo dosimetry simulations. Med Phys 2009;36(6):2154–2164. [DOI] [PMC free article] [PubMed] [Google Scholar]
- 13.Turner AC, Zhang D, Khatonabadi M, et al. The feasibility of patient size-corrected, scanner-independent organ dose estimates for abdominal CT exams. Med Phys 2011;38(2):820–829. [DOI] [PMC free article] [PubMed] [Google Scholar]
- 14.Li X, Samei E, Segars WP, Sturgeon GM, Colsher JG, Frush DP. Patient-specific radiation dose and cancer risk for pediatric chest CT. Radiology 2011;259(3):862–874. [DOI] [PMC free article] [PubMed] [Google Scholar]
- 15.Percentile data files with LMS Values . Centers for Disease Control and Prevention. http://www.cdc.gov/growthcharts/percentile_data_files.htm. Published August 2009. Accessed April 7, 2012.
- 16.Segars WP, Sturgeon G, Li X, et al. Patient specific computerized phantoms to estimate dose in pediatric CT. In: Samei E, Hsieh J, eds. Proceedings of SPIE: medical imaging 2009—physics of medical imaging. Vol 7258. Bellingham, Wash: SPIE–The International Society for Optical Engineering, 2009; 72580H. [Google Scholar]
- 17.Li X, Samei E, Segars WP, et al. Patient-specific radiation dose and cancer risk estimation in CT. II. Application to patients. Med Phys 2011;38(1):408–419. [DOI] [PMC free article] [PubMed] [Google Scholar]
- 18.Segars WP, Mahesh M, Beck TJ, Frey EC, Tsui BM. Realistic CT simulation using the 4D XCAT phantom. Med Phys 2008;35(8):3800–3808. [DOI] [PMC free article] [PubMed] [Google Scholar]
- 19.Segars WP, Sturgeon G, Mendonca S, Grimes J, Tsui BM. 4D XCAT phantom for multimodality imaging research. Med Phys 2010;37(9):4902–4915. [DOI] [PMC free article] [PubMed] [Google Scholar]
- 20.International Commission on Radiological Protection . Basic anatomical and physiological data for use in radiological protection: reference values. ICRP Publication 89. New York, NY: International Commission on Radiological Protection, 2002. [Google Scholar]
- 21.International Commission on Radiological Protection . The 2007 Recommendations of the International Commission on Radiological Protection, ICRP Publication 103. Essen, Germany: International Commission on Radiological Protection, 2007. [Google Scholar]
- 22.Li X, Samei E, Segars WP, et al. Patient-specific radiation dose and cancer risk estimation in CT. I. Development and validation of a Monte Carlo program. Med Phys 2011;38(1):397–407. [DOI] [PMC free article] [PubMed] [Google Scholar]
- 23.Baro J, Fernandezvarea JM, Salvat FPENELOPE: An algorithm for Monte Carlo simulation of the penetration and energy-loss of electrons and positrons in matter. Nucl Instrum Methods Phys Res B 1995;100(1):31–46. [Google Scholar]
- 24.Sempau J, Acosta E, Salvat F. Experimental benchmarks of the Monte Carlo code PENELOPE. Nucl Instrum Methods Phys Res B 2003;207(2):107–123. [Google Scholar]
- 25.National Research Council . Tracking radiation exposure from medical diagnostic procedures: workshop report. Committee on Tracking Radiation Doses from Medical Diagnostic Procedures; Nuclear and Radiation Studies Board; Division on Earth and Life Studies. Washington, DC: National Academies Press, 2012. [PubMed] [Google Scholar]
- 26.Segars WP, Bond J, Frush J, et al. Population of anatomically variable 4D XCAT adult phantoms for imaging research and optimization. Med Phys 2013;40(4):043701. [DOI] [PMC free article] [PubMed] [Google Scholar]
- 27.Tian X, Li X, Segars WP, Frush D, Paulson E, Samei E. Dose coefficients in pediatric and adult abdominopelvic CT based on 100 patient models. Phys Med Biol (in press?). [DOI] [PubMed] [Google Scholar]
- 28.Turner AC, Zankl M, DeMarco JJ, et al. The feasibility of a scanner-independent technique to estimate organ dose from MDCT scans: using CTDIvol to account for differences between scanners. Med Phys 2010;37(4):1816–1825. [DOI] [PMC free article] [PubMed] [Google Scholar]
- 29.Computed Tomography (CT) Systems : Global Market Outlook, 2012-2022. http://www.visiongain.com/Report/796/Computed-Tomography-(CT)-Systems-Global-Market-Outlook-2012-2022. Published April 2012. Accessed November 15, 2012.
- 30.van Straten M, Deak P, Shrimpton PC, Kalender WA. The effect of angular and longitudinal tube current modulations on the estimation of organ and effective doses in x-ray computed tomography. Med Phys 2009;36(11):4881–4889. [DOI] [PubMed] [Google Scholar]
- 31.Fricke BL, Donnelly LF, Frush DP, et al. In-plane bismuth breast shields for pediatric CT: effects on radiation dose and image quality using experimental and clinical data. AJR Am J Roentgenol 2003;180(2):407–411. [DOI] [PubMed] [Google Scholar]
- 32.Duan X, Wang J, Christner JA, Leng S, Grant KL, McCollough CH. Dose reduction to anterior surfaces with organ-based tube-current modulation: evaluation of performance in a phantom study. AJR Am J Roentgenol 2011;197(3):689–695. [DOI] [PubMed] [Google Scholar]


