Figure 4:

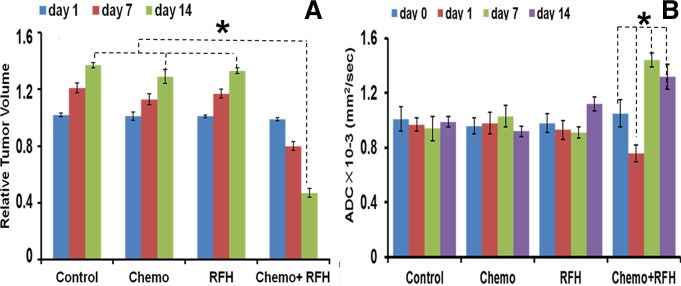
A, Bar graph shows average relative tumor volume in each group at different time points. Fourteen days after the treatment, the average relative tumor volume was the smallest in the combination therapy group, as compared with those in the other groups (* P = .001). B, Bar graph shows average ADCs in four animal groups treated with various therapies. The combination therapy group shows decreased ADCs at day 1 and increased ADCs at days 7 and 14 after treatment (* P < .001). RFH = RF hyperthermia.
