Figure 5:
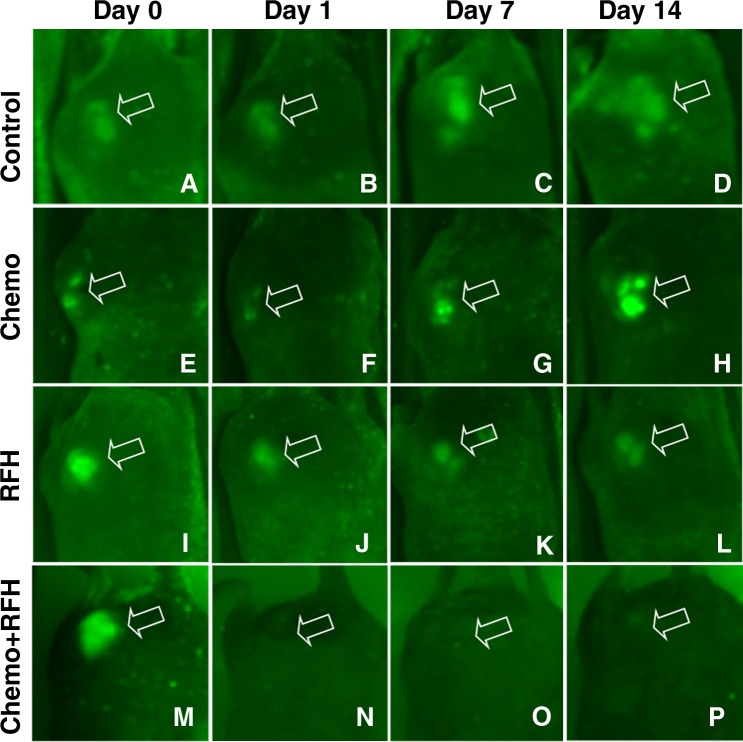
A–P, Optical images of GFP-labeled cholangiocarcinoma masses (arrow) in mice in different treatment groups. In, A–D, the control mouse and, E–H, the mouse treated with chemotherapy only, the tumor sizes and fluorescent signals increased over the 14-day follow-up period. In, I–L, the mouse treated with RF hyperthermia (RFH) only, the fluorescent signal slightly decreased at day 1 and then remained visible through day 14, while in, M–P, the mouse treated with combination therapy, the fluorescent signals were barely seen from day 1 through day 14 after treatment.

