
Figure 1.
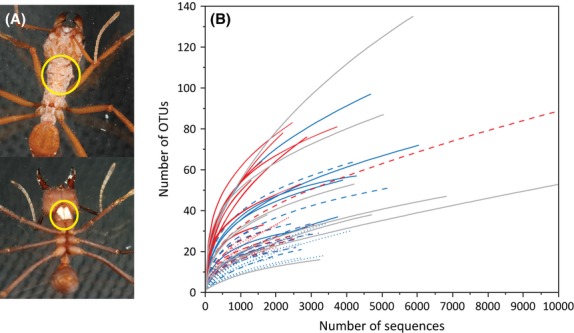
Bacterial abundance and diversity data obtained by 454 sequencing. (A) Dorsal view (top) of a callow worker of Acromyrmex echinatior covered in Pseudonocardia bacteria and ventral view (bottom) of a mature worker with bacterial growth concentrated on the laterocervical plates. Yellow circles indicate the parts of the cuticle that was dissected and sequenced. (B) Rarefaction curves of sequencing depth, each representing an individual sample and showing the observed number of OTUs as a function of simulated sequencing effort. Red curves represent samples from cluster 1 and blue curves samples from cluster 2 (see Fig. 2). Dotted curves are callow laboratory ants, dashed curves mature laboratory ants and solid curves field-collected ants. Curves based on other attine ant samples than A. echinatior and samples of A. echinatior that could not be placed in either cluster 1 or 2 are plotted in grey.