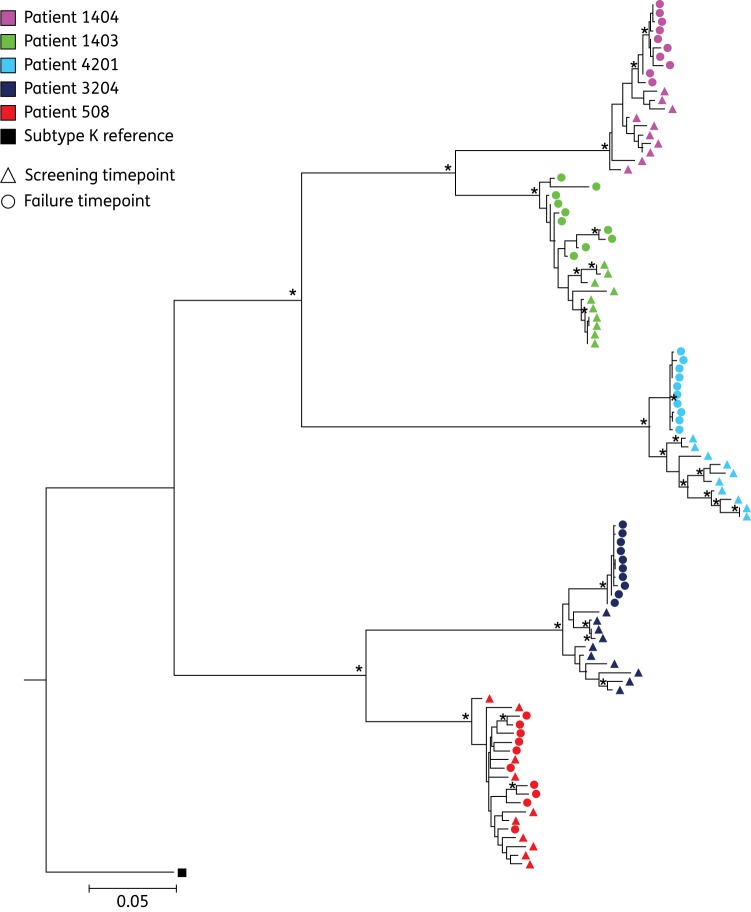
Figure 3.
Maximum likelihood phylogeny. A maximum likelihood tree constructed using the GTR model in PhyML using an alignment of all variants from baseline and failure timepoints from five patients. Variants from each patient are represented by a single colour, the screening variants by triangles and those from failure with circles. Nodes supported by >75% bootstrapping (≥350/500) are marked by an asterisk (*). This figure appears in colour in the online version of JAC and in black and white in the print version of JAC.

