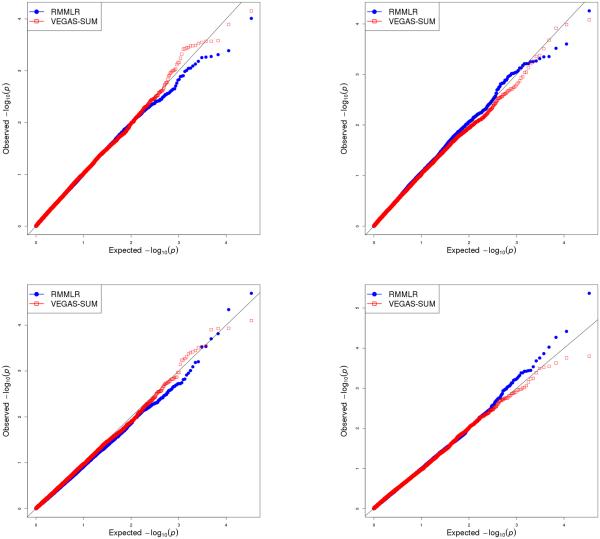
Figure 2.
Figure shows -log10(P-values) comparing the VEGAS-SUM and RMMLR approach for each of the 4 phenotypes NIC_FAC, DRG_FAC, ALC_FAC and BD_FAC respectively (top left, top right,bottom left, bottom right). There were 17600 genes. The filled squares show the qqplot of -log10(p-value)s for VEGAS-SUM approach. The filled circles show the qqplot of -log10(p-value)s from the RMMLR approach.

