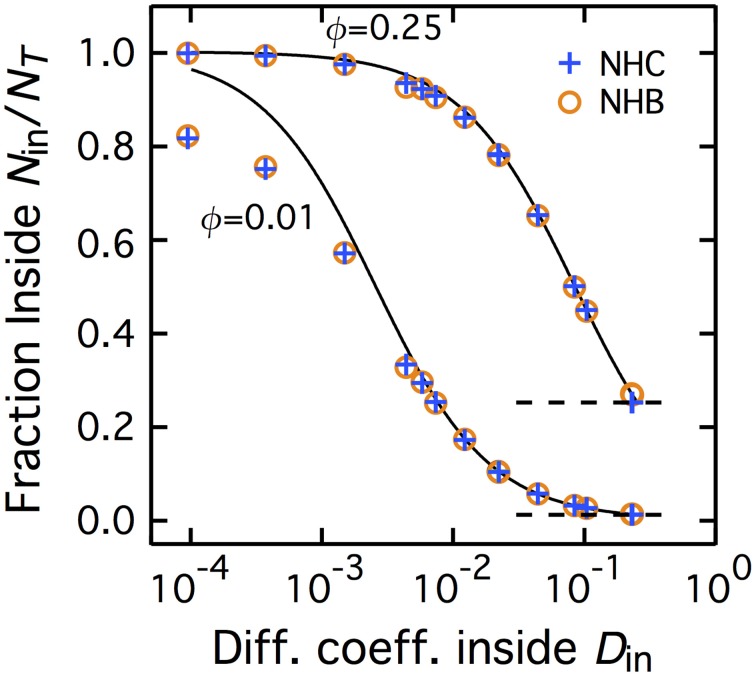
Figure 2.
Non-homogeneous CTRW and non-homogeneous Brownian yield identical accumulation inside the patch. The fraction of molecules inside the central patch Nin/NT at equilibrium increases with the slowdown of diffusion inside the patch (where Nin and NT are the number of molecules inside the central patch and the total number of molecules, respectively). NHC conditions are represented with blue plus signs whereas the NHB results are shown with brown empty circles. The full curves are the predictions from the theoretical expression for NHB, Equation (2) The dashed horizontal lines locate Nin/NT = 0.25 and Nin/NT = 0.01. The fraction area occupied by the central patch is ϕ = 0.25 (top curve) or 0.010 (bottom curve). In the NHC case, Din is here the macroscopic diffusion coefficient of the transient CTRW inside the patch.

